
The Complete Guide to Data Quality Monitoring for Strategic Business Growth
Discover how effective data quality monitoring drives business growth through better decision-making, increased efficiency, and reduced risks. Learn practical techniques and implementation frameworks to prevent the annual losses from poor data quality.
Organizations that heavily leverage data face a fundamental challenge: as data utilization increases across business functions, the propagation of poor-quality data accelerates in parallel.
Without effective data quality monitoring, substandard data doesn't remain isolated—it multiplies throughout interconnected systems, compounding in impact as it travels through pipelines, corrupting analytics, and ultimately compromising business performance at scale.
This isn't just an IT problem—it hits the bottom line hard. Gartner research shows that organizations lose an average of $15 million annually due to poor data quality. As more people across companies gain access to data, keeping it accurate through diligent data quality monitoring becomes both more crucial and tougher to manage.
Data quality monitoring has become a strategic necessity tied directly to growth and competitive edge. Companies that build strong monitoring systems don't just get better data—they make smarter decisions, operate more efficiently, and pull ahead of their competition.
In this article, we explore data quality monitoring, examine where data quality issues originate, and provide a comprehensive framework for implementation that aligns with your business objectives.
What is data quality monitoring?
Data quality monitoring is the systematic process of measuring, evaluating, and improving data across its lifecycle to ensure it meets business and technical requirements. Traditional approaches focused on finding problems after they occurred, but modern data quality monitoring emphasizes continuous, preventive checks built right into data pipelines.
Effective monitoring fits within broader data governance frameworks but maintains a clear focus on measurable standards and automated validation. As self-service analytics and cloud data platforms have grown, data quality monitoring has shifted from a centralized IT function to a shared responsibility across the organization.
Where do data quality issues originate from?
Data quality issues typically come from three main areas. Source systems often create data quality problems first. Errors in data entry, faulty sensors, or outdated information from external providers can introduce inaccuracies right at the start of the data journey.
Data pipelines are another critical spot where quality can deteriorate. Flawed transformations, data type mismatches, or integration errors can corrupt otherwise clean data as it moves through processing.
Consumption points like reports or dashboards can also introduce quality issues. Misinterpreting data definitions, incorrect calculations, or visualization errors can lead to wrong insights even when the upstream data is perfect.
Quality problems tend to multiply as data flows through systems, making early detection vital. Effective data quality monitoring needs to happen at all three stages rather than focusing on just one area.
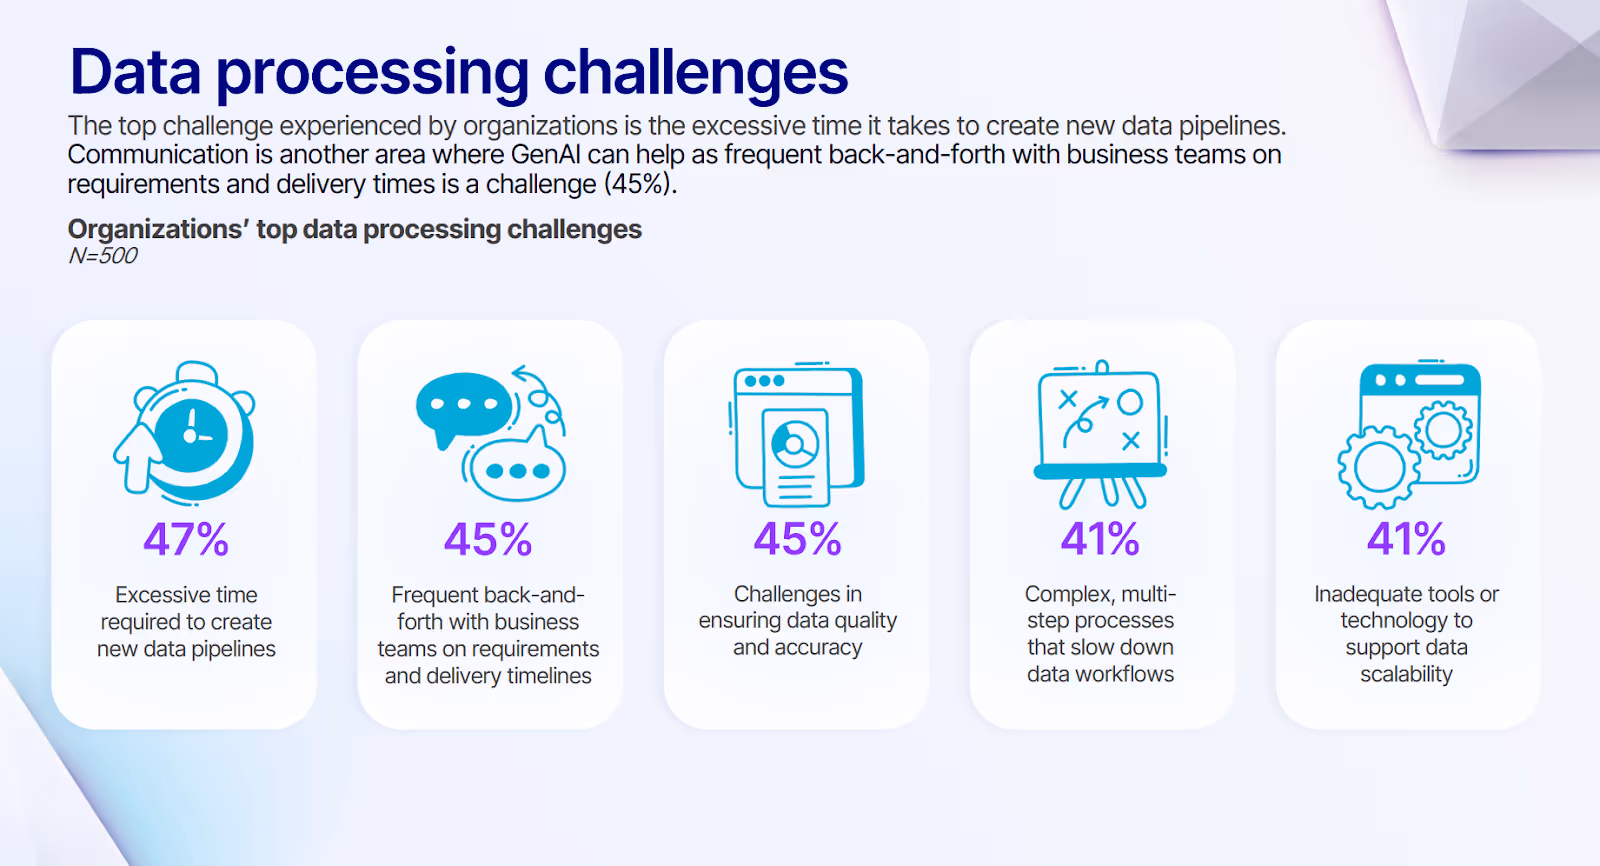
According to our survey, 45% of organizations experience these significant challenges in ensuring data quality and accuracy at scale. With limited resources stretched thin across multiple projects, many organizations struggle to implement comprehensive monitoring without dedicated tools that can automate and streamline the validation process.
Benefits of effective data quality monitoring
Implementing robust data quality monitoring thus offers numerous advantages that directly impact business performance across multiple dimensions:
- Enhanced Decision-Making: Better data leads to smarter decisions. Accurate, complete, and timely data directly impacts both day-to-day operations and long-term strategy. When people trust their data, they make choices with greater confidence and precision.
- Increased Operational Efficiency: Reliable data cuts down time spent fixing mistakes. For example, many retail companies have improved data quality in inventory systems, reducing stockouts by significant percentages, which boosts sales and streamlines supply chain operations.
- Compliance and Risk Management: Data quality monitoring reduces regulatory fines and reputation damage. For example, financial institutions implementing automated data validation often see substantial reductions in compliance infractions, significantly lowering the risk of penalties and audit issues.
- Improved Customer Experience: Quality data makes customer interactions better. Accurate customer profiles enable personalized services, while consistent data across touchpoints creates a seamless experience.
- Cost Savings: Preventing data issues costs less than fixing them. Proactive data quality monitoring can dramatically reduce this financial burden.
- Competitive Advantage: Organizations with better data outperform their rivals. Accurate data helps spot emerging trends before competitors, allowing faster and more effective strategic shifts.
Dimensions of data quality monitoring
To effectively monitor data quality, organizations must consider several key dimensions:
- Accuracy: Does your data correctly reflect reality? This involves checking that values are correct and fall within expected ranges.
- Completeness: Is all required data present? This ensures no critical information is missing from records or datasets.
- Consistency: Does your data tell the same story across different systems? This dimension checks for conflicting information or formatting differences.
- Timeliness: How current is your data, and can you access it when needed? This matters for time-sensitive decisions.
- Validity: Does your data follow the rules? This might include checking for proper formatting or adherence to specific standards, especially important when implementing ELT processes.
- Uniqueness: Are you free of duplicate records? This helps maintain a single source of truth.
- Integrity: Do related data elements maintain their connections? This ensures logical coherence across relationships and dependencies.
Key metrics for effective data quality monitoring
Turning quality dimensions into measurable indicators is essential for actionable monitoring. Here are some key metrics you should track.
Error ratio
The error ratio represents the percentage of incorrect values within your dataset, calculated as:
- Error ratio = (Number of incorrect values / Total number of values) × 100.
This metric serves as a fundamental indicator of overall accuracy, helping teams quickly gauge data reliability across systems. Measuring this requires comparing your data against verified sources or employing statistical validation techniques that can identify potential discrepancies automatically.
Organizations typically establish different thresholds based on data criticality, with mission-critical financial or healthcare data often requiring error ratios below 0.5%. Regular monitoring of this metric over time helps identify problematic data sources or processes that consistently introduce inaccuracies into your systems.
Duplicate record rate
Duplicate records undermine data integrity by creating confusion, wasting storage, and potentially skewing analytics with redundant information. This metric is calculated as:
- Duplicate record rate = (Number of duplicate records / Total number of records) × 100
Duplicate record rate quantifies the extent of duplication within datasets. Modern deduplication tools use both exact matching and fuzzy logic to identify similar records that might differ slightly in formatting or content.
High-performing organizations typically maintain duplicate rates under 1% for customer and transaction data. Tracking this metric longitudinally after data cleansing initiatives helps verify the effectiveness of your deduplication processes and identifies systems or integration points that frequently generate duplicates.
Data transformation errors
Transformation errors occur during data processing when records fail validation rules or encounter unexpected exceptions during pipeline execution. This metric is measured as:
- Data transformation errors = (Number of failed transformations / Total transformation attempts) × 100
Data transformation error metrics provide visibility into data pipeline health by quantifying processing failures that could compromise downstream data quality.
Effective organizations implement progressive monitoring that catches transformation issues early in the pipeline process. By tracking error trends over time and correlating them with system changes or data source modifications, teams can proactively address recurring problems before they impact business operations or analytical accuracy.
Completeness rate
The completeness rate measures the presence of required values across your datasets, calculated as:
- Completeness rate = (Number of populated required fields / Total number of required fields) × 100
This metric highlights potential gaps that could undermine analysis or operational processes. It analyzes both record-level completeness (percentage of records with all required fields) and field-level completeness (percentage of population for specific attributes).
Different data domains require customized completeness thresholds based on business impact. While customer contact information might target 99% completeness for critical communication fields, analytical datasets might tolerate lower rates for supplementary attributes while maintaining strict requirements for primary dimensions.
Consistency score
Consistency scores evaluate data uniformity across different systems, timeframes, or related datasets that should contain matching information. Calculated as:
- Consistency score = (Number of matching records across systems / Total records compared) × 100
This metric identifies discrepancies that could lead to conflicting reports, misaligned business processes, or contradictory customer experiences across departments or channels.
Organizations often implement cross-system reconciliation processes that regularly validate master data elements, with mature data governance programs tracking consistency trends to measure the effectiveness of data synchronization mechanisms.
Data freshness
Data freshness measures how current your information is relative to real-world conditions, directly impacting the relevance and reliability of business decisions. This time-based metric is calculated as:
- Data freshness = (Time of data availability - Time of last update)
It identifies the interval between data creation, modification, and availability to business users, helping identify bottlenecks in data pipelines.
Different data categories require appropriate freshness standards based on business needs. While financial trading systems might require near-real-time freshness measured in milliseconds, monthly sales analysis might consider data fresh within a 24-hour window after the reporting period closes.
Seven essential data quality monitoring techniques
Let's explore seven essential techniques that can help you establish a robust data quality monitoring system.
1. Data auditing
Data auditing systematically evaluates data against predefined standards to ensure accuracy, completeness, and compliance. Unlike continuous monitoring, auditing focuses on periodic, comprehensive reviews.
Data audits serve both compliance and operational purposes. In regulated industries like healthcare and finance, audits validate adherence to strict data standards. Operationally, they verify the effectiveness of data processes and identify areas for improvement.
Modern data platforms can automate portions of the audit process, reducing manual effort. Human judgment remains crucial for contextual evaluation and interpreting audit results.
Regular audits complement other monitoring techniques by providing deeper, more holistic assessments of data quality at scheduled intervals.
2. Data cleansing and remediation
Data cleansing identifies and corrects errors or inconsistencies in datasets to improve overall quality. Common cleansing techniques include standardization (enforcing consistent formats), deduplication (identifying and merging duplicates), and enrichment (adding missing values from reference sources).
Automation plays a significant role in streamlining cleansing workflows. Modern tools use machine learning to automate corrections and enhance accuracy. Balance automated correction with human review, especially for high-impact data elements.
Effective data cleansing requires clear rules for what constitutes "correct" data. Integrating cleansing with ongoing data quality monitoring helps prevent the recurrence of issues and maintains data quality over time.
3. Metadata management
Metadata management organizes information about data assets to enable better understanding, governance, and usability. It combines technical metadata (schema, format, storage location) with business metadata (definitions, ownership, usage guidelines) to provide context for quality assessment.
Rich metadata serves as the foundation for effective data quality monitoring by establishing clear expectations for what "good data" looks like in different contexts. Metadata catalogs help identify quality dependencies and impact areas when issues arise.
Modern data platforms like Databricks offer automated metadata collection, enhancing governance while reducing manual documentation burden. This automation is crucial for maintaining up-to-date and accurate metadata in dynamic data environments.
4. Data profiling and statistical analysis
Data profiling examines data to understand its structure, content, and relationships. Profiling techniques such as column statistics, pattern recognition, and distribution analysis help detect anomalies and validate assumptions about data quality.
In practice, for example, financial institutions use profiling to validate customer data consistency across systems. This helps identify discrepancies that could lead to compliance issues or poor customer experience.
Modern tools can automate profiling as part of pipeline execution, making it an integral part of the data workflow rather than a separate process. This integration allows for continuous data quality monitoring and early detection of issues.
Presenting profiling results to both technical and business users builds a shared understanding of data assets, fostering a data-driven culture across the organization.
5. Rule-based validation
Rule-based validation establishes specific criteria that data must meet to be considered valid. Different types of validation rules include domain constraints (valid value ranges), relationship rules (referential integrity), calculation checks (formula validation), and format verification (structural requirements).
These rules are typically implemented in data pipelines, particularly in modern cloud platforms. It's important to balance between hard rules (that reject data) and soft rules (that flag potential issues without blocking).
Centrally managed rule libraries can be applied flexibly across different data domains, ensuring consistency while allowing for domain-specific customization.
6. Anomaly detection and pattern recognition
Statistical and machine learning techniques can identify outliers and unusual patterns that may indicate quality issues. Approaches include statistical methods (z-scores, IQR), clustering algorithms, and time-series analysis for trend detection.
These techniques can automatically flag unusual patterns, such as unexpected customer transaction behavior or data drift in production models. Establishing baseline patterns is crucial before implementing automated detection. This ensures that the system can accurately distinguish between normal variations and true anomalies.
Anomaly detection complements rule-based approaches by catching unexpected issues that predefined rules might miss, providing a more comprehensive data quality monitoring strategy.
7. Data lineage tracking
Data lineage documents data's journey from source to consumption, including all transformations and dependencies. This tracking helps with root cause analysis of quality issues, impact assessment of proposed changes, and compliance verification.
For example, a customer address error might be traced to a specific integration point, allowing for targeted correction and prevention of similar issues in the future.
Implementing lineage tracking in modern data platforms often involves metadata capture at transformation points, such as within a medallion architecture. Effective data lineage tracking should provide both technical details for engineers and business context for analysts, bridging the gap between technical and business perspectives on data quality.
A comprehensive framework to implement data quality monitoring in your organization
Implementing an effective data quality monitoring system requires a strategic approach that balances technical implementation with organizational considerations. This framework provides a roadmap for organizations to build monitoring systems that serve both governance requirements and business user needs.
Align quality standards with business objectives
The first step in implementing a comprehensive data quality monitoring framework is to connect quality requirements directly to business goals and outcomes. This alignment ensures that monitoring efforts focus on the most critical aspects of data quality for your organization.
Engage business stakeholders to define quality standards that reflect their actual needs rather than purely technical considerations. For example, customer data might prioritize accuracy and completeness, while financial data emphasizes consistency and timeliness.
Translate these business requirements into specific, measurable quality thresholds. This translation process helps bridge the gap between high-level business objectives and concrete data quality metrics that can be monitored and acted upon.
Remember that standards should focus on the quality dimensions most relevant to specific use cases rather than applying uniform standards across all data. This targeted approach ensures that monitoring efforts are efficient and impactful.
Root cause analysis and issue identification
Developing methodical approaches for identifying the underlying causes of data quality problems is crucial for long-term improvement. Rather than just addressing symptoms, focus on tracing quality issues back to their source—whether in collection methods, transformation logic, or system interfaces.
Utilize data profiling and lineage tracking to identify where and why quality degradation occurs. These techniques help visualize the flow of data through your systems and pinpoint areas where issues are introduced or exacerbated.
Implement frameworks for categorizing and prioritizing issues based on business impact rather than just technical severity. This approach ensures that your team focuses on resolving the most critical problems first.
Effective root cause analysis should lead to systemic improvements that prevent similar issues in the future, not just one-time fixes. By addressing underlying causes, you can significantly reduce the recurrence of quality problems over time.
Implement continuous monitoring solutions
To effectively deploy and scale data quality monitoring across your organization, start with critical data assets and expand monitoring coverage incrementally. This phased approach allows you to refine your processes and demonstrate value before full-scale implementation.
Akram Chetibi, Director of Product Management at Databricks, explains how modern data initiatives require both technical solutions and organizational alignment. The organizations seeing the most success are those that approach data quality monitoring as a continuous process rather than a one-time project, gradually expanding their coverage as they mature their practices.
When selecting monitoring tools, consider integration capabilities with existing data platforms, including various data integration methods, scalability requirements, and the balance between automated and human-in-the-loop monitoring. Look for solutions that can grow with your data ecosystem and adapt to changing business needs.
Establish alerting thresholds that balance sensitivity (catching issues) with specificity (avoiding alert fatigue). Fine-tune these thresholds over time based on feedback and observed patterns to optimize your monitoring system's effectiveness.
Test monitoring solutions thoroughly to ensure accuracy and effectiveness before full deployment. This testing phase helps identify any gaps or false positives in your monitoring setup, allowing for adjustments before relying on the system for critical decision-making.
Integrate quality checks into data pipelines
Embedding quality validation directly into data processing workflows is more effective than applying it as a separate, after-the-fact process. This integration allows for real-time quality assurance and faster issue resolution.
Implement quality gates within ETL processes, including validation before loading, during transformation, and post-processing verification. These gates act as checkpoints to ensure data meets defined quality standards at each stage of processing.
Design pipeline-integrated quality checks to automatically handle exception cases. For example, you might route problematic records to remediation workflows while allowing valid data to proceed. This approach minimizes disruptions to data flow while ensuring quality issues are addressed.
Capture quality metadata from pipeline checks and make it visible to both engineers and business users. This transparency helps build trust in the data and allows for quick identification of quality trends or emerging issues.
Power self-service quality monitoring with modern tools
As organizations become more data-driven, they need robust data quality monitoring that balances central governance with distributed, self-service access. Traditional approaches often create bottlenecks—data teams get swamped with quality issues while business users can't see if their data is reliable.
Prophecy addresses these challenges head-on by providing visual interfaces, automated validation, and integrated workflows that help data engineers build and maintain data quality monitoring systems.
At the same time, it lets analysts understand and act on quality information without needing deep technical expertise. This approach spreads data quality responsibility across the organization, building a culture where everyone trusts and values good data.
Here are key ways Prophecy supports effective data quality monitoring:
- Visual Data Lineage: Easily trace data origins and transformations, enabling quick identification of quality issues at their source. This visual approach makes complex data flows accessible to both technical and non-technical users.
- Automated Quality Checks: Integrate predefined and custom quality rules directly into data pipelines. These checks can automatically validate data against business rules, statistical norms, and historical patterns, flagging issues before they impact downstream processes.
- Self-Service Dashboards: Provide business users with intuitive, role-based dashboards that offer real-time visibility into data quality metrics. This empowers non-technical staff to monitor and address quality issues within their domains of expertise.
- Collaborative Issue Resolution: Enable seamless collaboration between data engineers and business users through integrated workflows. When quality issues are detected, the system can automatically route alerts and initiate remediation processes involving the right stakeholders.
- Metadata-Driven Governance: Leverage rich metadata to enforce data governance policies consistently across the organization. This ensures that self-service activities remain compliant with enterprise standards and regulatory requirements.
To overcome the growing backlog of data quality issues that prevent organizations from fully trusting their data, explore How to Assess and Improve Your Data Integration Maturity to empower both technical and business teams with self-service quality monitoring.

Ready to give Prophecy a try?
You can create a free account and get full access to all features for 21 days. No credit card needed. Want more of a guided experience? Request a demo and we’ll walk you through how Prophecy can empower your entire data team with low-code ETL today.
Ready to see Prophecy in action?
Request a demo and we’ll walk you through how Prophecy’s AI-powered visual data pipelines and high-quality open source code empowers everyone to speed data transformation
Get started with the Low-code Data Transformation Platform
Meet with us at Gartner Data & Analytics Summit in Orlando March 11-13th. Schedule a live 1:1 demo at booth #600 with our team of low-code experts. Request a demo here.
Related content
A generative AI platform for private enterprise data
Introducing Prophecy Generative AI Platform and Data Copilot
Ready to start a free trial?
Lastest posts

The Future of Data Is Agentic: Key Insights from Our CDO Magazine Webinar

Analytics as a Team Sport: Why Data Is Everyone’s Job Now

12 Must-Have Skills for Data Analysts to Avoid Career Obsolescence

