
Stop Data Pipeline Failures Before They Impact Your Business Operations
Learn how effective data pipeline monitoring prevents costly business failures and turns operational excellence into a strategic business advantage.
Data pipeline failures can lead to lost revenue, missed opportunities, and eroded customer trust. Yet most organizations discover these failures the same way their predecessors did decades ago–when frustrated business users report that their dashboards show stale data or their automated processes stop working.
This reactive approach transforms data teams from strategic enablers into perpetual firefighters, constantly scrambling to restore systems that should never have broken in the first place.
This article transforms your approach from reactive problem-solving to proactive data reliability management, helping you build monitoring that prevents business disruptions and turns operational excellence into a competitive advantage.
Let's begin with the fundamentals.
What is data pipeline monitoring?
Data pipeline monitoring is the systematic observation and management of data flows across your entire information ecosystem. Unlike basic system monitoring that simply tracks whether services are running, pipeline monitoring encompasses data quality validation, performance optimization, business impact assessment, and proactive issue detection throughout the complete data lifecycle.
Modern pipeline monitoring goes far beyond traditional uptime checks. It validates that data meets quality standards, flows within acceptable timeframes, and delivers the business value your organization depends on.
This comprehensive approach catches issues before they cascade through downstream systems, preventing the costly disruptions that plague reactive monitoring strategies.
The scope extends from initial data ingestion through transformation, storage, and final consumption by business applications. Effective monitoring creates visibility into not just what data is moving, but whether that movement supports business objectives and maintains the trust that stakeholders place in data-driven decisions.
Data pipeline monitoring vs observability vs alerting
These three concepts work together but serve distinct purposes in maintaining data reliability:
Pipeline monitoring provides the foundational metrics and health checks that feed into broader observability platforms. When monitoring detects an issue, observability tools help investigate the root cause and understand the broader impact across interconnected systems.
On the other hand, alerting ensures the right people know about problems that require immediate attention, but without effective monitoring and observability, alerts often create more noise than value.
The distinction matters because each serves different decision-making needs. Monitoring answers "what is happening now," observability explains "why it's happening and what it affects," and alerting ensures "the right people know about it quickly."
Organizations that conflate these approaches often end up with gaps in coverage or overwhelming noise that obscures real issues.
The benefits of effective data pipeline monitoring
Let's examine the distinct advantages organizations gain when they implement effective data pipeline monitoring solutions:
- Prevent costly business disruptions before they impact operations: Eliminates the downstream costs of bad data propagating through business processes, regulatory reports, and customer experiences.
- Accelerate time-to-resolution through precise issue identification: When problems occur, comprehensive monitoring pinpoints exactly which component failed, what data was affected, and which downstream systems require attention.
- Build stakeholder confidence through transparent data reliability: Business users gain visibility into data freshness strategies, quality metrics, and processing status through intuitive data pipeline monitoring dashboards that communicate system health in business terms.
- Enable proactive capacity planning and resource optimization. Performance monitoring reveals trends in processing times, resource utilization, and data volumes that inform infrastructure planning.
- Establish accountability through clear service-level agreements. Monitoring provides the metrics needed to define and measure data SLAs, creating clear expectations between data teams and business stakeholders.
- Reduce operational overhead through intelligent automation. Advanced monitoring enables automated responses to common issues, from retrying failed jobs to scaling resources during peak loads.
How to choose data pipeline monitoring tools
Most organizations approach data pipeline monitoring tool selection backwards—they start with features and vendors rather than understanding why their current monitoring consistently fails to prevent business disruptions.
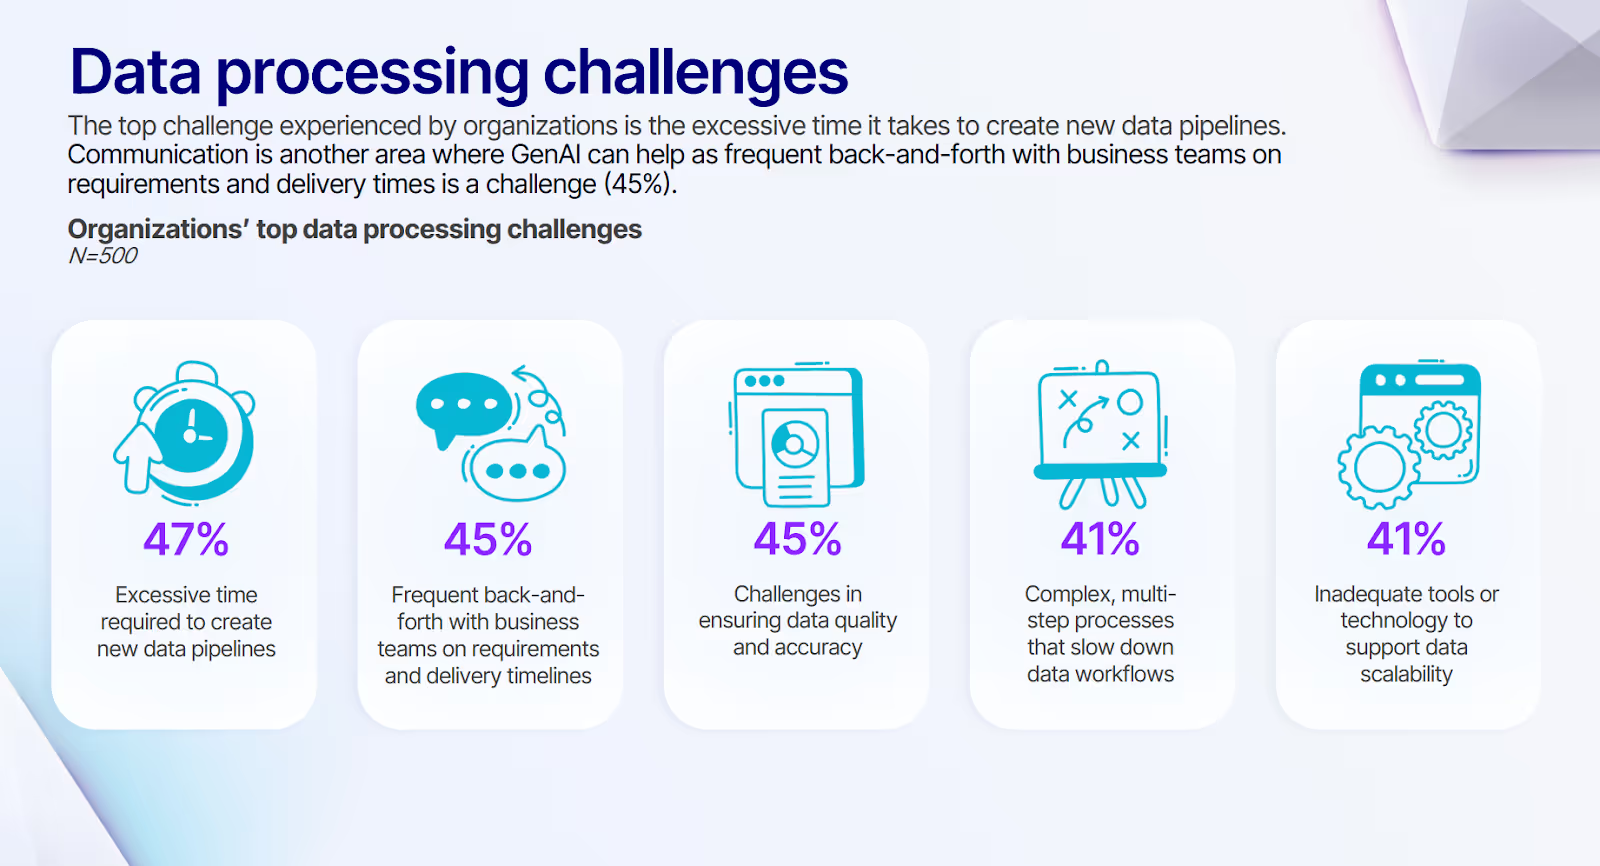
This reactive approach explains why 41% of surveyed organizations report that inadequate tools remain a significant barrier to effective data scalability, trapping teams in endless cycles of firefighting rather than enabling proactive optimization.
The issue is choosing tools that align with how your organization actually operates and scales. Let’s see the key things to consider.
Data quality monitoring capabilities
Data quality issues represent the most common and costly pipeline failures, making quality monitoring your first priority. Quality problems discovered late in development create major bottlenecks that require extensive rework and delay time-to-value.
Effective quality monitoring validates schema consistency, completeness thresholds, data quality checks, and business rule compliance at every pipeline stage. Look for solutions that can automatically detect anomalies in data distributions, identify missing or duplicate records, and flag violations of business logic before they propagate downstream.
The most valuable tools learn normal patterns in your data and alert when deviations exceed acceptable bounds. Consider platforms that integrate quality monitoring directly into development workflows rather than treating it as a separate operational concern.
When data engineers can see data quality metrics during pipeline development, they catch issues earlier and build more robust solutions. This shift-left approach, along with effective data auditing, prevents quality problems from reaching production while building quality consciousness into development practices.
Modern quality monitoring should also provide business-friendly visualizations that communicate data health in terms that stakeholders understand. Rather than technical error logs, look for tools that translate quality metrics into business impact assessments, helping prioritize fixes based on downstream effects rather than technical severity alone.
Performance and scalability monitoring
Performance bottlenecks often emerge gradually as data volumes grow, making them difficult to detect without systematic monitoring. The most effective performance monitoring tracks not just current execution times but trends that indicate emerging scalability challenges before they affect business operations.
Monitor end-to-end pipeline latency alongside individual component performance to identify where bottlenecks occur and how they affect downstream processes in your data pipeline architecture.
Resource utilization metrics help distinguish between temporary spikes and systemic capacity issues, informing decisions about scaling infrastructure versus optimizing code. Look for solutions that correlate performance metrics with business calendars, seasonal patterns, and data volume fluctuations.
Choose monitoring tools that provide actionable insights rather than raw metrics. The best platforms identify specific optimization opportunities, suggest resource allocation changes, and predict when current capacity will become insufficient. This proactive guidance helps data teams optimize performance before problems affect business operations.
Integration with your existing infrastructure monitoring creates a complete picture of system health. Performance issues in data pipelines often stem from broader infrastructure problems, and unified monitoring helps identify root causes faster. Look for solutions that can correlate pipeline performance with database health, network conditions, and compute resource availability.
Business impact and SLA tracking
Technical monitoring tells you what's happening in your systems, but business impact monitoring reveals what those events mean for your organization. The most valuable monitoring solutions translate technical metrics into business language, helping stakeholders understand how data pipeline health affects their operations.
Track SLA compliance for critical data deliveries, an essential aspect of effective governance, measuring not just whether pipelines complete successfully but whether they meet the timing and quality requirements that business processes depend on.
Monitor downstream application health to understand how pipeline issues propagate through business systems, creating visibility into the full impact of data problems.
Business impact monitoring should also track positive outcomes, not just failures. Measure improvements in data freshness, reductions in manual intervention, and increases in automated processing success rates. These positive metrics help justify monitoring investments and identify opportunities for further optimization.
Consider solutions that can automatically assess the business criticality of different pipelines and adjust monitoring sensitivity accordingly. Not all data has the same business impact, and effective monitoring focuses attention on issues that matter most to organizational success while reducing noise from less critical systems.
Self-service monitoring with governance
The democratization of data requires monitoring solutions that business users can understand and interact with, while maintaining the governance and security standards that enterprise data requires.
When choosing data pipeline tools, look for platforms that provide role-based views, giving different stakeholders appropriate visibility into system health without exposing sensitive operational details.
Self-service monitoring dashboards should translate technical metrics into business terminology, allowing analysts and business users to understand data pipeline status without requiring deep technical knowledge. The most effective solutions provide guided troubleshooting that helps non-technical users identify common issues and escalate appropriately when expert intervention is needed.
Governance capabilities should also include audit trails that track who accessed monitoring data, what changes were made to monitoring configurations, and how sensitive information was handled. Look for solutions that integrate with existing identity management systems and provide granular access controls that align with your data governance policies.
Modern monitoring platforms often include collaboration features that enable cross-functional teams to work together on data issues. Consider tools that support commenting, issue tracking, and workflow management to facilitate the coordination between business stakeholders and technical teams that effective data operations require.
Why data pipeline monitoring implementations fail despite great tools
Even with sophisticated monitoring tools, many organizations struggle to achieve reliable data operations. The fundamental issue often lies not in the technology itself but in how monitoring is conceived, implemented, and integrated into broader data practices.
The silent failure syndrome
Traditional monitoring approaches focus heavily on system availability while overlooking the subtle data quality issues that cause the most business damage.
A pipeline can appear healthy from a technical perspective–completing on schedule, consuming appropriate resources, producing expected output volumes–while delivering fundamentally flawed data that undermines business decisions.
Silent failures manifest when schema changes in source systems break downstream transformations without triggering obvious errors. Data gets processed successfully, but business logic assumptions no longer hold, leading to incorrect calculations that propagate through reporting systems.
These issues often remain undetected for weeks or months because technical monitoring shows green lights while business logic quietly fails.
The most insidious silent failures occur when data quality gradually degrades over time. Small increases in null values, subtle shifts in data distributions, or slowly growing inconsistencies between related datasets rarely trigger alerts but eventually compromise analytical accuracy. By the time business users notice problems, the cumulative impact can be substantial.
Preventing silent failures requires monitoring that understands data semantics, not just system mechanics. Effective approaches validate business rules, monitor data relationships, and track quality trends that indicate emerging problems.
This semantic monitoring catches issues that traditional technical monitoring misses, preventing the costly discoveries that occur when business stakeholders lose confidence in data-driven insights.
Reactive fire-fighting vs proactive prevention
Most monitoring implementations follow the same reactive pattern: wait for problems to occur, then build monitoring to detect similar issues in the future. This retrospective approach means organizations are always fighting the last war, continuously expanding monitoring coverage in response to each new failure mode they discover.
The reactive mindset creates a vicious cycle where data teams spend increasing amounts of time managing and monitoring systems rather than improving data products.
Alert fatigue sets in as monitoring expands to cover more potential issues, often with insufficient tuning to distinguish between genuine problems and benign anomalies. Teams begin ignoring alerts or raising thresholds to reduce noise, creating gaps in coverage that allow real issues to slip through.
Proactive monitoring requires understanding your data ecosystem well enough to anticipate likely failure modes rather than waiting to discover them through painful experience. This approach focuses on monitoring the health of data relationships, the consistency of business logic, and the alignment between data patterns and business expectations.
The shift from reactive to proactive monitoring often requires both cultural and technical changes.
Teams must invest time in understanding data quality patterns, documenting business logic assumptions, and building monitoring that validates ongoing data health rather than just catching obvious failures. This upfront investment pays dividends in reduced operational overhead and improved data reliability.
Silos creating dangerous blind spots
Many organizations implement monitoring in data silos, with different teams responsible for different aspects of the data pipeline. Infrastructure teams monitor system health, data engineers track pipeline execution, and business teams watch for unexpected results in their reports.
These disconnected monitoring approaches create blind spots where issues fall between organizational boundaries.
Siloed monitoring often means that problems get detected multiple times by different systems, creating confusion about root causes and appropriate responses. More dangerously, issues that span organizational boundaries may not get detected at all, as each team assumes another group is monitoring those aspects of the system.
The fragmentation becomes particularly problematic when trying to understand the business impact of technical issues. Infrastructure monitoring might detect resource constraints, but without integration with pipeline monitoring, teams can't quickly determine which data processes are affected.
Similarly, business users might notice data anomalies, but without a connection to technical monitoring, they can't easily identify the root cause.
Unified monitoring approaches break down these silos by providing integrated views that span technical and business perspectives. The most effective implementations create shared dashboards that different stakeholders can use to understand issues from their perspective while maintaining visibility into the broader context that affects their specific concerns.
Alert fatigue paralyzes effective response
The proliferation of monitoring tools often leads to alert overload, where teams receive so many notifications that they become desensitized to genuine problems. This alert fatigue represents one of the most common monitoring failures, transforming monitoring systems from helpful early warning mechanisms into sources of constant interruption.
Alert fatigue typically develops when monitoring thresholds are set too conservatively, generating notifications for benign anomalies that don't require intervention. Teams initially respond to every alert, but as the volume increases and many alerts prove to be false positives, response rates decline. Eventually, genuine problems get lost in the noise of routine notifications.
The problem intensifies when different monitoring systems generate overlapping alerts for the same underlying issue. A single data quality problem might trigger notifications from pipeline monitoring, downstream application monitoring, and business process monitoring, creating the appearance of multiple urgent issues when only one root cause needs attention.
Effective alert management requires intelligent filtering that considers business context, issue severity, and response requirements. The best monitoring systems learn from historical patterns to distinguish between alerts that require immediate attention and those that can be batched for routine review.
This intelligence reduces notification volume while ensuring critical issues receive appropriate priority.
Relieve engineering burden with a unified data platform
The shift from reactive problem detection to proactive business enablement requires moving beyond traditional monitoring tools and approaches that focus solely on preventing failures toward comprehensive observability. This transformation typically starts with unified monitoring that breaks down the silos between technical metrics and business outcomes.
Here’s how Prophecy delivers this unified approach through comprehensive monitoring and observability that spans the entire data pipeline lifecycle:
- Integrated development and monitoring environments that catch quality issues during pipeline creation rather than after deployment, dramatically reducing the time spent debugging production problems
- AI-powered anomaly detection that learns normal data patterns and identifies subtle quality degradation before it affects business operations, preventing the silent failures that traditional monitoring misses
- Business-impact dashboards that translate technical metrics into stakeholder-friendly insights, building confidence in data-driven decisions while reducing the constant questioning that occurs when data reliability is uncertain
- Automated remediation capabilities that resolve common issues without human intervention, freeing data engineering teams from routine operational tasks to focus on strategic initiatives
- Unified governance and observability that provides consistent monitoring across all data pipelines while maintaining the flexibility to adapt to different business requirements and compliance standards
- Self-service monitoring interfaces that empower business users to understand data pipeline health without requiring deep technical expertise, reducing operational overhead while improving stakeholder satisfaction
To prevent costly architectural missteps that delay data initiatives and overwhelm engineering teams, explore 4 data engineering pitfalls and how to avoid them to develop a scalable data strategy that bridges the gap between business needs and technical implementation.

Ready to give Prophecy a try?
You can create a free account and get full access to all features for 21 days. No credit card needed. Want more of a guided experience? Request a demo and we’ll walk you through how Prophecy can empower your entire data team with low-code ETL today.
Ready to see Prophecy in action?
Request a demo and we’ll walk you through how Prophecy’s AI-powered visual data pipelines and high-quality open source code empowers everyone to speed data transformation
Get started with the Low-code Data Transformation Platform
Meet with us at Gartner Data & Analytics Summit in Orlando March 11-13th. Schedule a live 1:1 demo at booth #600 with our team of low-code experts. Request a demo here.
Related content
A generative AI platform for private enterprise data
Introducing Prophecy Generative AI Platform and Data Copilot
Ready to start a free trial?
Lastest posts

The Future of Data Is Agentic: Key Insights from Our CDO Magazine Webinar

Analytics as a Team Sport: Why Data Is Everyone’s Job Now

12 Must-Have Skills for Data Analysts to Avoid Career Obsolescence

