
8 Essential Data Quality Metrics for Governed Self-Service Data Preparation
Learn how modern data quality metrics balance self-service freedom with governance, prevent the annual losses from poor data quality, and build analytics users can actually trust.
Companies today face a critical balancing act: democratizing data access while ensuring data remains trustworthy and accurate. As business users increasingly build their own data workflows, the risk of data quality issues compounds rapidly.
This challenge extends far beyond technical concerns into financial territory. Gartner analysis reveals a sobering reality—organizations forfeit approximately $15 million yearly due to data quality shortcomings. With self-service data preparation becoming standard practice, establishing robust quality monitoring becomes simultaneously more essential and more complex.
Implementing effective data quality metrics is the key to balancing speed with accuracy in self-service data environments. With proper metrics in place, you can give people the freedom they need while keeping your data trustworthy.
In this article, we'll explore the essential data quality metrics that matter for building trust in self-service data preparation environments.
What are data quality metrics?
Data quality metrics are quantifiable measures used to assess the reliability, accuracy, and fitness of data for its intended purpose. In self-service data preparation, these metrics have evolved to address the challenges posed by the shift from ETL to modern ELT processes and the rise of business-led analytics.
Traditional metrics mainly focused on accuracy and completeness, but today's self-service world demands more.
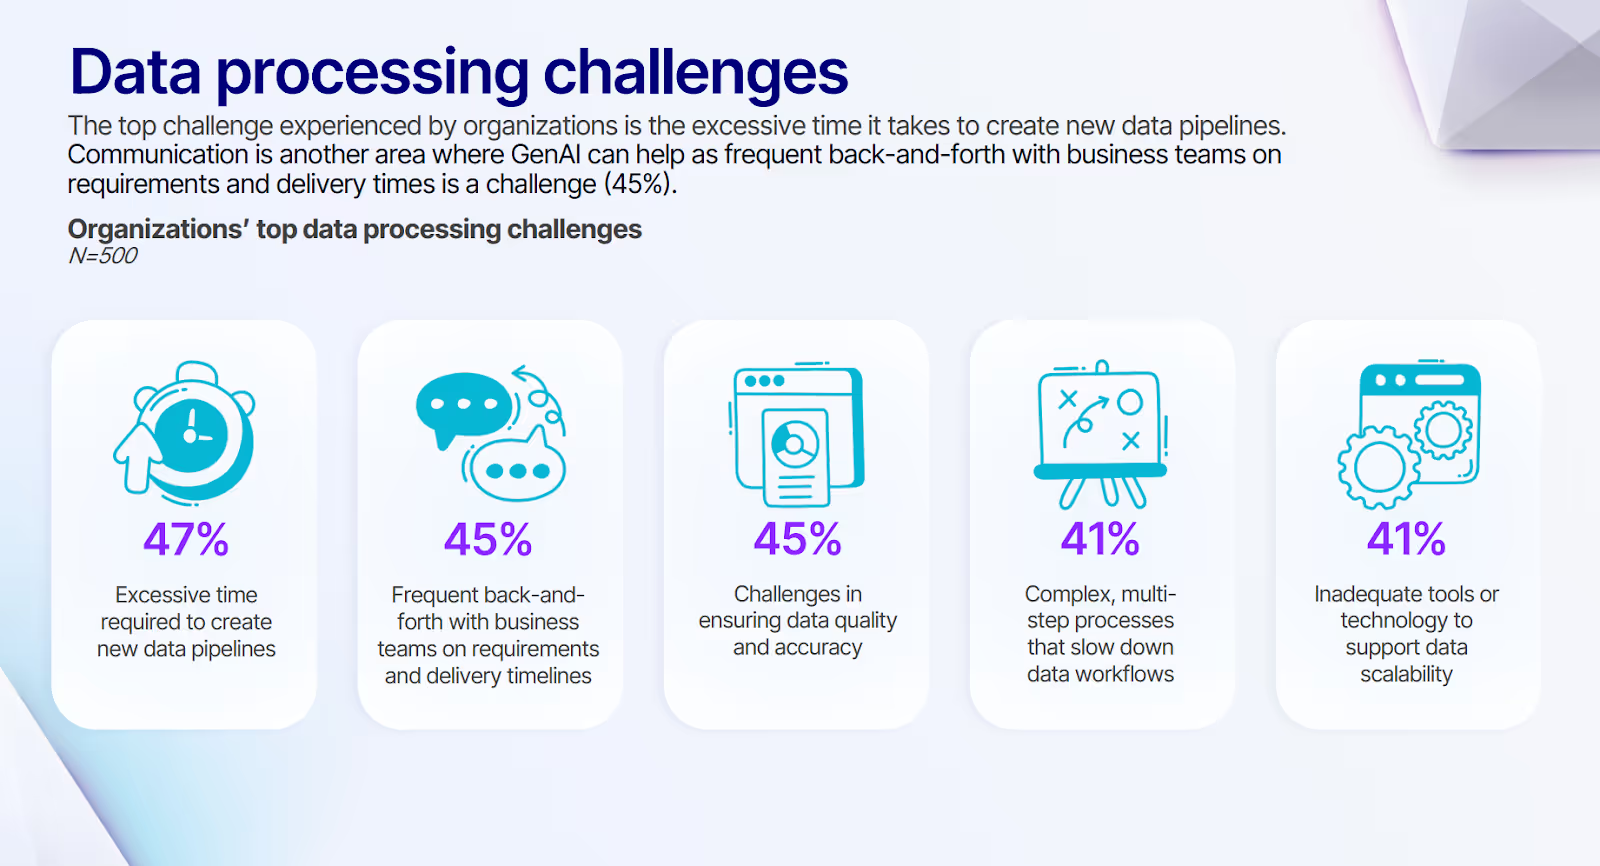
According to our recent survey, 45% of organizations still face significant challenges in ensuring data quality and accuracy, highlighting how critical efficient, quality-focused data preparation has become.
As business analysts build their own data pipelines, our metrics need to connect technical quality with business trust. Take completeness metrics—they've evolved beyond just counting non-null values. They now check whether all data points needed for specific business processes exist.
Accuracy metrics have grown up, too. They don't just check if data matches a source—they verify how well it represents real-world things or events. This matters tremendously in healthcare, where wrong patient data can have serious consequences.
The connection between governance and data quality metrics
For modern businesses, governance and quality metrics are two sides of the same coin. Good governance isn't about putting up barriers; it's about building quality into every step of data preparation.
Central data teams need to see what business users are creating without becoming bottlenecks. This takes a careful mix of oversight and empowerment. Automatic quality checks, clear data lineage, and standard processes all help maintain this balance.
By weaving data governance principles into self-service tools, you can build a quality-focused culture without killing innovation or speed.
Data quality dimensions vs. data quality metrics vs. KPIs
People often mix these terms up, but data quality dimensions, metrics, and KPIs each play distinct roles in keeping data reliable.
- Data quality dimensions are the fundamental traits of data: accuracy, completeness, timeliness, and consistency.
- Data quality metrics are specific measurements of these dimensions. For instance, you might measure completeness by calculating the percentage of non-null values in your dataset.
- Key performance indicators connect data quality to business outcomes. They translate technical details into language everyone can understand.
Here's a simple example: The completeness dimension becomes a metric (95% of customer records have all required fields filled), which connects to a KPI (reliable financial reporting for quarterly earnings calls).
In self-service environments, these distinctions matter. They help technical and business teams communicate effectively about data quality and its business impact.
Eight essential data quality metrics for governed self-service
For governed self-service data preparation, certain data quality metrics stand out as critical for balancing technical quality with business value. These metrics support both central data teams and business analysts in ensuring data reliability and accuracy.
The following metrics represent the most crucial dimensions to measure for maintaining data quality in a self-service environment:
These metrics form the foundation for establishing a robust data quality framework in governed self-service data preparation. Let’s look into each of these in more detail.
Data quality metric #1: Data pipeline test coverage
Data pipeline test coverage measures the percentage of data transformation logic that includes validation checks. This metric is critical in self-service environments where non-engineers are building data pipelines, as it ensures that data quality is maintained throughout the transformation process.
Central data teams can define standard tests that business users easily plug into their pipelines. This balances flexibility with quality control. For example, think of a financial services company creating standard tests for customer data that analysts apply to their custom reporting pipelines.
Additionally, test coverage prevents business errors with major downstream impacts. Imagine an analyst creating a financial reporting pipeline without proper testing. A small transformation error could lead to inaccurate financial statements, causing compliance issues or bad business decisions.
Prophecy's visual pipeline builder makes this easy by letting users add data validation steps directly in their workflows. This helps business users maintain high-quality standards without needing deep technical skills. Making test coverage part of the development process reduces quality risks and builds confidence in analytics and reporting, and is essential when scaling ETL pipelines.
Data quality metric #2: Data profile completeness
Data profile completeness gives you X-ray vision into your datasets, showing value distributions, nulls, and outliers. Combined with effective data ingestion strategies, this metric becomes your early warning system when business users connect to new data sources on their own. By measuring profile completeness, you catch problems early before they contaminate downstream analytics.
This becomes even more vital in self-service environments. When business analysts connect to new data sources independently, automated profiling acts like a safety net. It helps non-technical people quickly understand what they're working with, without requiring a data science degree.
The tools available today have transformed profiling completely. Modern platforms offer automated profiling that makes results accessible to everyone. This democratization puts quality checks in the hands of business users from day one of their analysis.
To improve your data profile completeness, track:
- Percentage of columns profiled in each dataset
- How recently profiles were updated
- How well profiles cover key quality dimensions (completeness, accuracy, consistency)
Focus on these metrics to ensure your profiling efforts are thorough and current, creating a solid foundation for trustworthy analytics across your business.
Data quality metric #3: Schema change detection rate
Schema changes in source systems can silently break data pipelines, leading to unreliable or incorrect data flowing through your analytics ecosystem. This is particularly dangerous in self-service environments where business users may not understand the technical dependencies between datasets.
Measuring how effectively your environment detects and alerts on schema changes is crucial. A high schema change detection rate means you're catching potential issues early, before they propagate downstream and impact business decisions.
For example, if a new column is added to a source table without proper notification, reports and dashboards relying on that data could become inaccurate or incomplete.
To improve your schema change detection rate, consider implementing automated monitoring tools that can scan for changes in source system schemas on a regular basis. Many modern data integration platforms offer this capability out of the box, eliminating the need for manual checks.
Akram Chetibi, Director of Product Management at Databricks emphasized how the future of data integration depends on intelligent schema management. Organizations that implement proactive schema change detection gain agility without sacrificing reliability—a critical balance as data volumes and sources continue to multiply.
By prioritizing schema change detection, you build trust in your self-service data preparation environment. Business users can confidently create and modify data pipelines, knowing there are safeguards in place to catch potential breaking changes. This balance of flexibility and control is key to scaling data-driven decision-making across your organization.
Data quality metric #4: Pipeline observability score
Pipeline observability is like having X-ray vision into your data workflows through logs, monitoring, and alerts. This metric shows how visible and traceable your pipelines are—critical for both central teams and business users.
A high observability score means you can quickly diagnose issues, track where data comes from, and understand how pipelines perform. For central teams supporting pipelines they didn't build, this visibility is essential for troubleshooting. Business users benefit by knowing when something breaks and why, without needing to become technical experts.
To calculate your pipeline observability score, look at:
- How detailed your logging is at each pipeline stage
- Whether you have real-time monitoring dashboards
- If you've set up automated alerts for failures or unusual data
- How well you can trace data through the entire pipeline
Better observability drastically cuts your troubleshooting time. For example, a pharma company that implemented comprehensive observability in their customer data pipelines can reduce their issue resolution time from hours to minutes.
Modern data platforms can also provide robust observability without requiring business users to understand complex monitoring systems. This gives everyone pipeline visibility while maintaining the depth needed when problems arise.
David Jayatillake, VP of AI at Cube, mentioned how observability isn't just about technical monitoring—it's about creating transparency that builds trust between technical and business teams. When business users can see how data moves through systems, they make better decisions about how to use that data in their analyses.
Data quality metric #5: Data lineage visibility
Data lineage visibility tracks where data came from and how it changed along the way. This metric helps you understand data's journey from source to destination, showing its quality, reliability, and compliance status.
In self-service environments with multiple teams creating data pipelines, data lineage becomes even more vital. It lets you trace quality issues to their source and understand how changes affect your entire data ecosystem.
To measure lineage visibility, calculate what percentage of pipelines have complete lineage tracking. This means assessing how well you can trace data from its origin through all transformations to its final use. Comprehensive data lineage should cover both technical metadata (e.g., table and column names) and business context (e.g., how the data is used in reports)."
Strong data lineage tracking offers several benefits:
- Better troubleshooting: When issues appear, lineage visibility helps pinpoint where they started.
- Change impact analysis: Before changing pipelines, you can see what might break downstream.
- Regulatory compliance: Many industries require proof of data origins for audits.
- Data trust: When users see where data came from and how it changed, they trust it more.
Today's visual data tools capture and display lineage automatically. This beats manual documentation, which is often incomplete or quickly outdated.
Data quality metric #6: Standardization compliance rate
Standardization compliance measures how well your data pipelines follow organizational patterns and best practices. When many teams build pipelines in self-service environments, maintaining standards becomes crucial for maintainability, performance, and governance.
To track standardization compliance, measure the percentage of pipelines following defined best practices across teams and users. This might include using approved data types, following naming conventions, or implementing required security controls. Tools with automated code review features can help enforce and measure compliance at scale.
Reusable components play a key role in driving standardization. Prophecy's Packages feature lets teams create pre-approved building blocks that enforce standards automatically when used. This reduces the thinking load on business users while ensuring high-quality, compliant pipelines.
Data quality metric #7: Pipeline adoption rate
Pipeline adoption rate shows how often the data pipelines your teams create actually drive business decisions. This metric reveals whether your data preparation efforts deliver real value. By tracking adoption, you can spot which pipelines generate insights and which ones need improvement or retirement.
To measure adoption effectively, track both numbers and impact:
- Numbers include query frequency, unique users, and data volume processed.
- Impact focuses on business decisions influenced and their results.
For example, a marketing analytics pipeline with high query volume but minimal influence on campaigns may have lower adoption value than a less frequently used pipeline that drives major product decisions.
Tracking adoption across departments helps identify where your data democratization succeeds or falls short. You might discover that finance teams leverage pipelines extensively while sales teams barely use available data assets. This insight helps you target training where it's needed most.
Visual interfaces like Prophecy's play a crucial role in boosting adoption rates. By making it easier for business users to discover and use existing pipelines, these interfaces reduce duplicate work and encourage the reuse of well-built data assets. This improves efficiency and promotes consistency in how data is used across your organization.
Remember, high adoption isn't just about usage—it's about impact. Regularly assess how pipeline outputs influence key business metrics and decision-making. This ensures your data preparation efforts truly drive value and competitive advantage.
Data quality metric #8: Resource efficiency
Resource efficiency measures how well your data pipelines use available compute and memory resources. This directly affects both costs and performance, especially in cloud environments where you pay for what you use. Think of it as the gas mileage for your data operations.
This metric becomes even more critical in self-service data environments. Business users who don't understand the cost implications of their data operations can accidentally create inefficient processes that drive up cloud bills. By tracking resource efficiency, you give business users freedom while preventing runaway costs.
Key aspects to measure include:
- Cost per query: What's the average price tag for running typical data queries?
- Execution time trends: Are your queries getting faster or slower over time?
- Resource waste: Which resources sit idle or are underutilized?
You don't need to burden business users with technical optimization. Instead, implement features that automatically improve efficiency. Automatic query optimization, smart caching, and intelligent resource allocation based on workload patterns can dramatically boost efficiency without requiring users to become performance experts.
Consistently measuring and improving resource efficiency cuts costs while making your data operations faster and more scalable. This leads to quicker insights, more responsive analytics, and a competitive edge in your data-driven decision-making.
How to bring data governance and quality together
The most successful data organizations understand that governance and quality aren't separate initiatives—they're two sides of the same coin. When integrated effectively, they create a virtuous cycle that enables self-service while maintaining trust in data assets.
Start by embedding quality metrics directly into your governance framework. Rather than creating separate standards, define quality thresholds as part of your data policies. This ensures data quality becomes an enforceable aspect of governance, not just a nice-to-have.
Involve both business and technical stakeholders in defining what "good data" means for your organization. Central data teams understand the technical dimensions, while business users know what quality means in practical terms. When these perspectives align, quality metrics become meaningful to everyone.
Then, leverage automation to reduce the governance burden. Visual pipeline tools that enforce standards while checking quality seamlessly integrate these functions without creating bottlenecks. This approach transforms governance from a restrictive process into an enabler of quality.
Build feedback loops between quality measurements and governance practices. When quality metrics decline, governance protocols should adapt. Likewise, when governance processes change, quality metrics should reflect whether those changes helped or hindered data reliability.
This integrated approach creates a foundation where business users can confidently access and prepare data while maintaining enterprise-grade quality standards.
Power self-service data preparation without sacrificing data quality
Success in ensuring data quality means balancing self-service capabilities with solid governance. You need solutions that let business users prepare data quickly while maintaining reliability. This is where platforms like Prophecy shine, connecting technical capabilities with business needs.
Prophecy's data integration platform offers a fresh approach to governed self-service data preparation. Here's how Prophecy helps maintain quality standards while democratizing data access:
- Visual Pipeline Builder: Prophecy gives business users an intuitive interface for creating data pipelines, automatically generating production-grade code that follows best practices.
- Automated Data Validations: Prophecy lets users build validation directly into data pipelines, catching schema mismatches or missing values without requiring technical expertise.
- Metadata Management: Prophecy tracks lineage and usage throughout the data lifecycle, showing how data moves and transforms across your organization.
- Collaborative Workflows: Prophecy supports reviews where data engineers can optimize and approve business-created pipelines before deployment, ensuring quality and performance.
- Integration with Data Quality Tools: Prophecy connects seamlessly with specialized platforms, letting you leverage existing investments in tools like Great Expectations or Datafold.
To overcome the growing backlog of data quality issues that prevent organizations from fully trusting their data, explore How to Assess and Improve Your Data Integration Maturity to empower both technical and business teams with self-service quality monitoring.

Ready to give Prophecy a try?
You can create a free account and get full access to all features for 21 days. No credit card needed. Want more of a guided experience? Request a demo and we’ll walk you through how Prophecy can empower your entire data team with low-code ETL today.
Ready to see Prophecy in action?
Request a demo and we’ll walk you through how Prophecy’s AI-powered visual data pipelines and high-quality open source code empowers everyone to speed data transformation
Get started with the Low-code Data Transformation Platform
Meet with us at Gartner Data & Analytics Summit in Orlando March 11-13th. Schedule a live 1:1 demo at booth #600 with our team of low-code experts. Request a demo here.
Related content
A generative AI platform for private enterprise data
Introducing Prophecy Generative AI Platform and Data Copilot
Ready to start a free trial?
Lastest posts
The Future of Data Is Agentic: Key Insights from Our CDO Magazine Webinar
Analytics as a Team Sport: Why Data Is Everyone’s Job Now
12 Must-Have Skills for Data Analysts to Avoid Career Obsolescence

