
PySpark hands-on tutorial using a visual IDE
Let's get started with PySpark using a visual interface to generate open-source Spark code.
Learn by example
Let's see how a lead engineer would organize a project and write concise, readable code.
Toggle from code to visual design to see how each function fits into the bigger picture.
Now that I've sparked your interest, let's breakdown the steps so that everyone can build a PySpark pipeline:
1. Sign into the Spark IDE using Databricks (1m) or directly via Prophecy (1m)
2. Create a new project and specify your spark cluster defaults (1m)
3. Create pipeline, connect pipeline to a Spark cluster, browse & load data (1.5m)
4. Explore transformations - toggle to view code (2m)
5. Transform, join, aggregate in your own pipeline. (maybe try a join hint!) (5+ min)
6. Commit PySpark code changes to your git repo (1m)
7. Add a custom script (10+ min)
8. Run the pipeline
9. Repartition your data (to fix a failing job) as described below and re-run (3m)
10. Congratulate yourself for building an actual pySpark pipeline!
We've seen how to use Prophecy's IDE for Spark. Now let's dig into a pro-tip to consider when moving Python workloads to PySpark.
Distributed computing
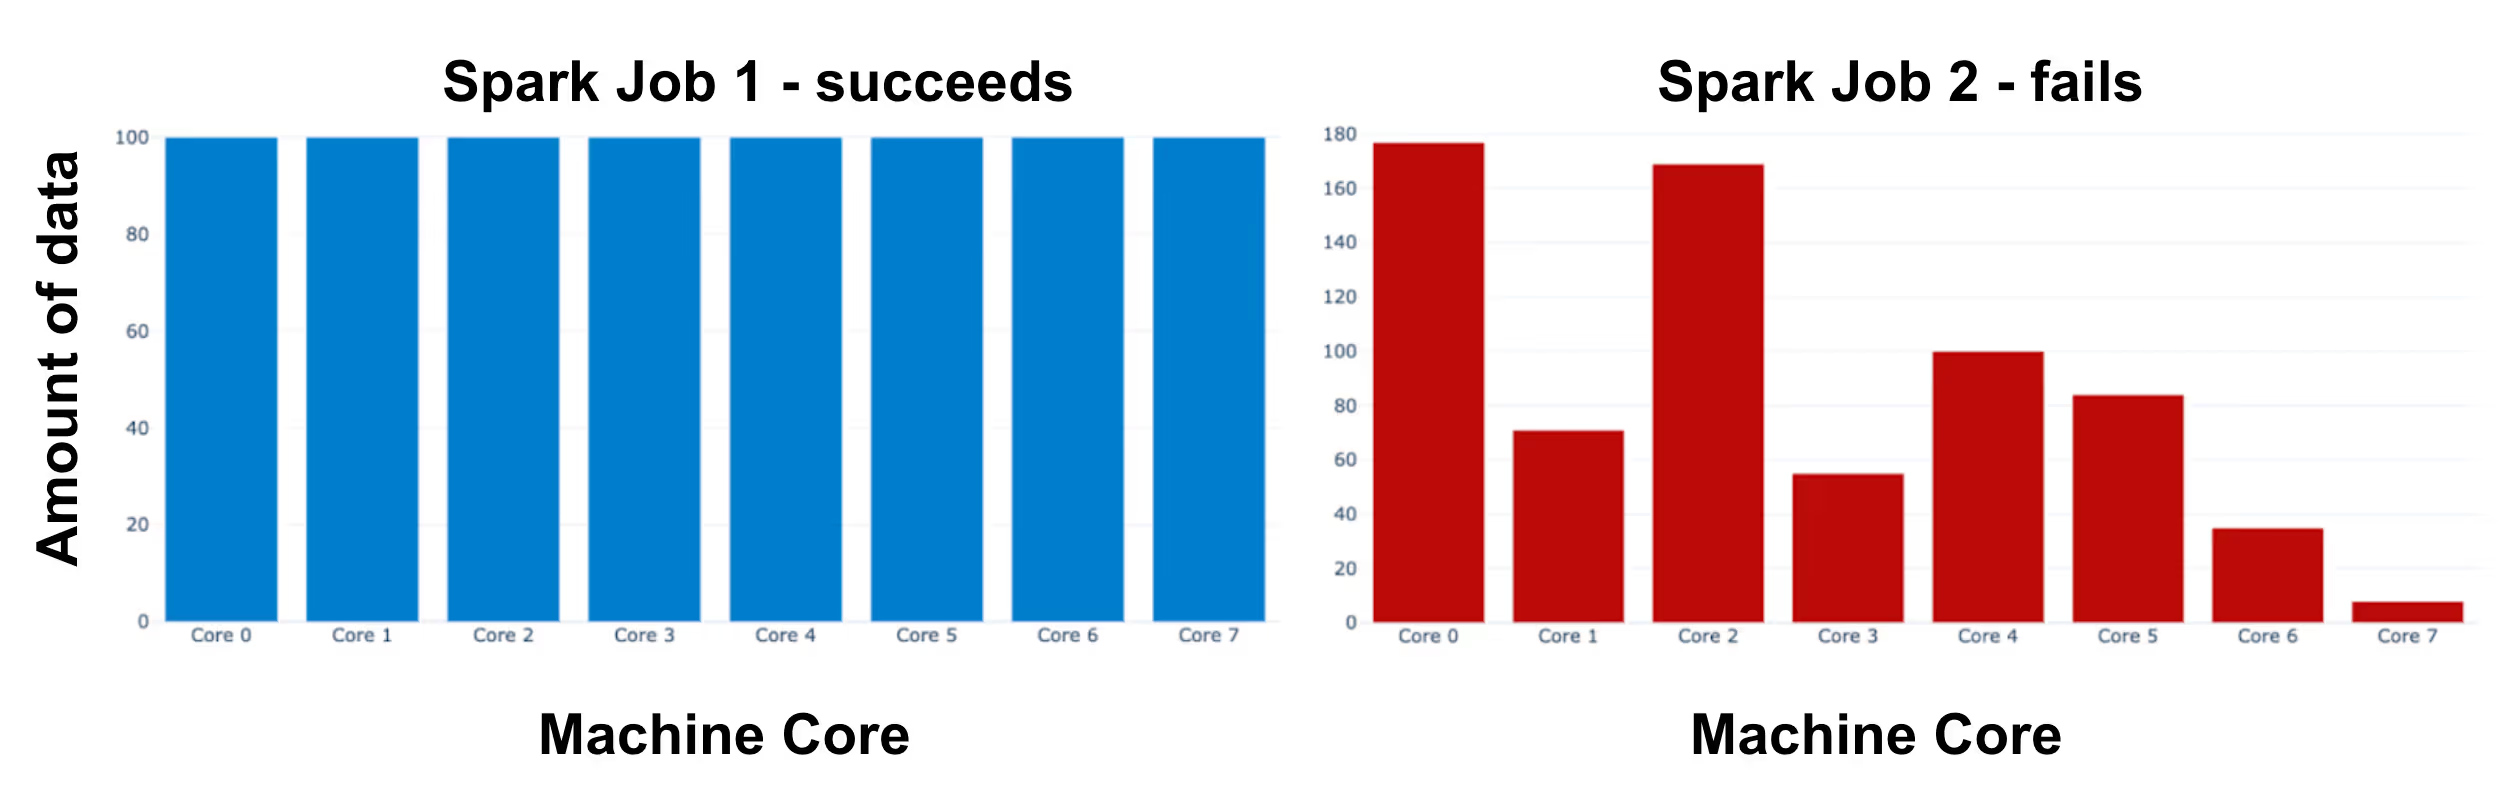
Traditional Python workloads run on a single machine (maybe a laptop or virtual machine). But here we're using PySpark, so we have to consider how the data is distributed across many machines. Figure 3 illustrates one PySpark job (left) which is crunching approximately the same amount of data on each machine core. On some occasions*, a PySpark job (right) can time out or fail because some machine cores are crunching much more data than the rest. This problem is called "skewed data" because the data is unevenly distributed across machine cores.
What do we do if our PySpark job is failing due to skewed data?
Skewed data can be resolved by repartitioning the dataframe (or RDD) for a more even distribution. Repartitioning causes a "shuffle." This costs time and resources, which is appropriate to resolve a failing job. In the IDE, we can choose a partition type and expression (or key). Let's run the job and check the Spark UI! Each task is included in a summary metrics table, displaying the amount of data read for that particular shuffle.
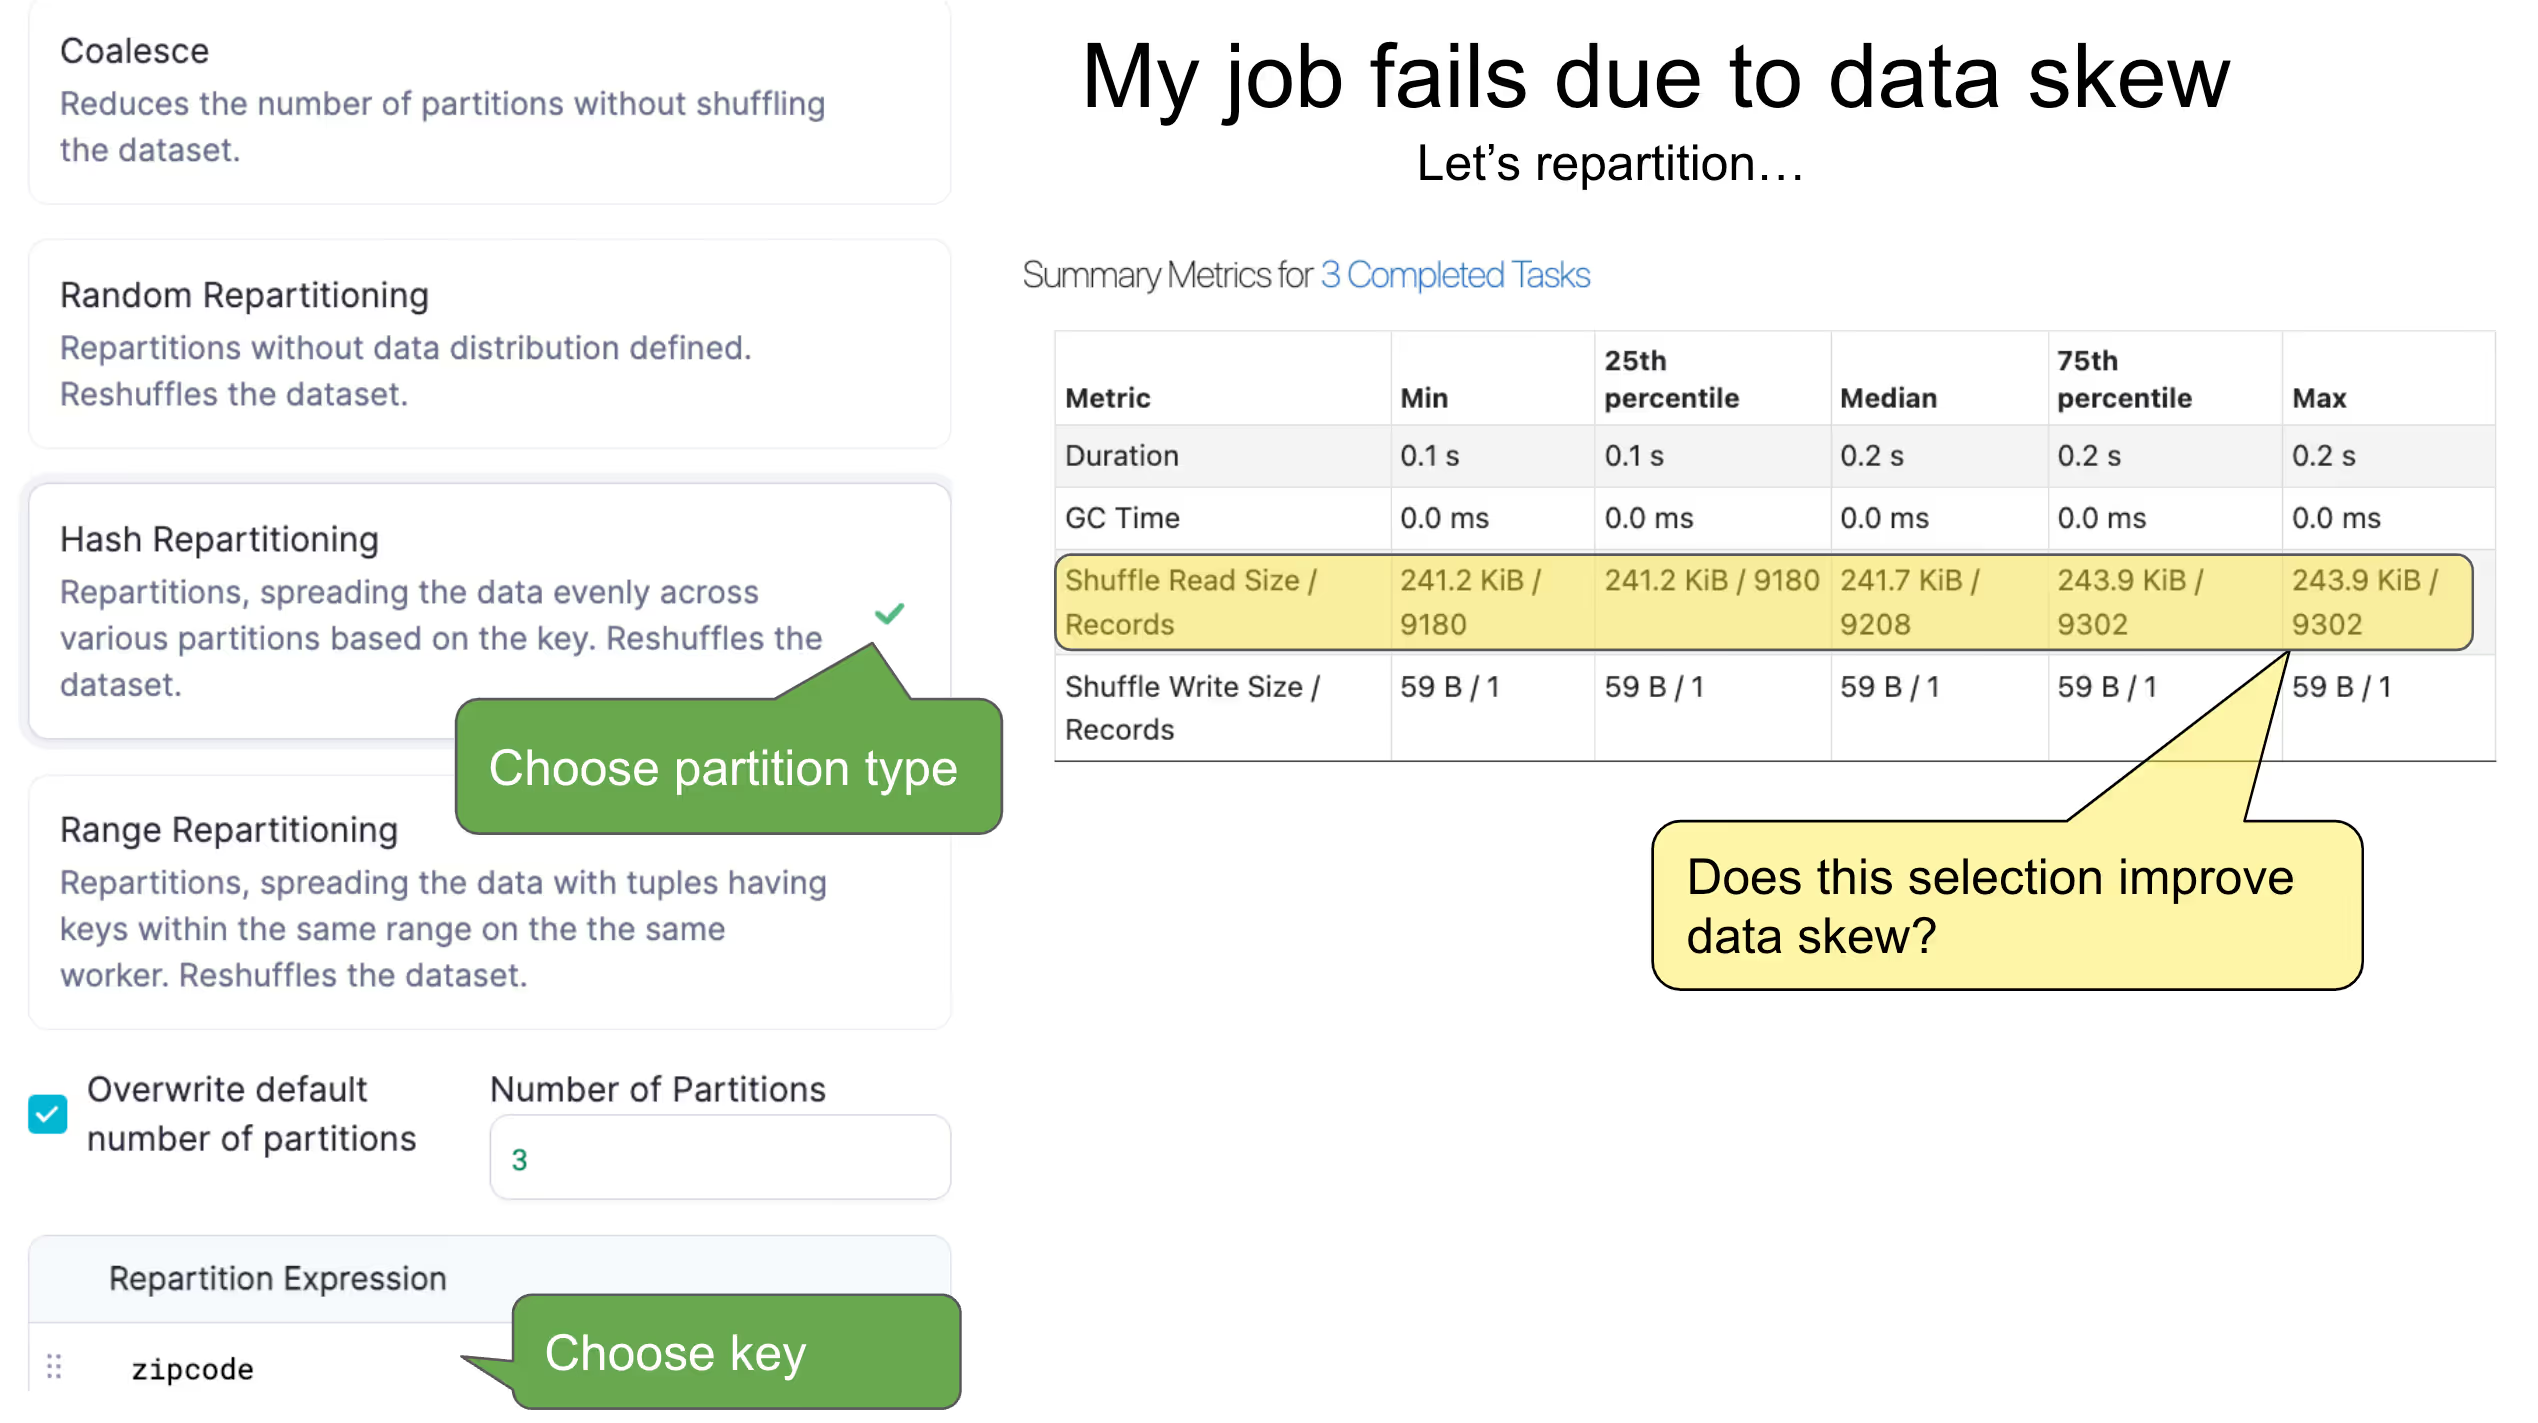

The partition type, key, and number of partitions can be adjusted depending on the dataset and pipeline. I suggest to try a couple options and see what works best for your data. Usually partitioning on a date works if the data is relatively evenly distributed over multiple days. Partitioning on zipcode is usually not the best option because some zipcodes would have many more rows than others. Experiment with repartitioning until the job no longer fails due to skewed data. Also consider adjusting the partition strategy upon first reading the data into Spark. Get familiar with partitioning, as this topic comes up frequently when moving Python workloads to PySpark. Good thing tuning and troubleshooting can be accomplished via the Spark IDE.
This has been the PySpark Hands-On Tutorial! We got familiar with a new IDE, and learned by example how to code a variety of transformations using pySpark. Finally we walked through a pySpark pro-tip on repartitioning.

PS What would you like to see in my next tutorial? Ping me or schedule a session with me or my team.

Ready to give Prophecy a try?
You can create a free account and get full access to all features for 21 days. No credit card needed. Want more of a guided experience? Request a demo and we’ll walk you through how Prophecy can empower your entire data team with low-code ETL today.
Ready to see Prophecy in action?
Request a demo and we’ll walk you through how Prophecy’s AI-powered visual data pipelines and high-quality open source code empowers everyone to speed data transformation
Get started with the Low-code Data Transformation Platform
Meet with us at Gartner Data & Analytics Summit in Orlando March 11-13th. Schedule a live 1:1 demo at booth #600 with our team of low-code experts. Request a demo here.
Related content
A generative AI platform for private enterprise data
Introducing Prophecy Generative AI Platform and Data Copilot
Ready to start a free trial?
Lastest posts

The Future of Data Is Agentic: Key Insights from Our CDO Magazine Webinar

Analytics as a Team Sport: Why Data Is Everyone’s Job Now

12 Must-Have Skills for Data Analysts to Avoid Career Obsolescence

