A Guide to Query Optimization Techniques for Databricks SQL
Unlock top Databricks SQL features with these 7 advanced query optimization techniques. Speed up your data pipelines and improve performance now!
Even Databricks SQL, with its powerful distributed processing capabilities, can struggle when faced with petabytes of data and complex analytical workloads. Inefficient queries don't just run slowly—they consume excessive compute resources, driving up cloud costs while keeping critical insights just out of reach.
When queries take hours instead of minutes, business decisions stall, and frustration mounts. Franco Patano, Lead Product Specialist at Databricks, explained how data engineers find themselves constantly explaining delays to stakeholders who need answers now, not tomorrow. Meanwhile, cloud usage bills climb as inefficient operations waste expensive compute resources.
The true cost of inefficient queries goes beyond compute resources; it affects business agility and the ability to make timely data-driven decisions.
In this article, we explore Databricks SQL and proven optimization strategies that can dramatically improve query performance, reduce processing times, lower costs, and unlock faster insights from your data.
What is Databricks SQL?
Databricks SQL is a unified analytics platform that brings together data warehousing and data lake capabilities, allowing organizations to run high-performance SQL queries against massive datasets stored in Delta Lake format. Built on Apache Spark, it provides a scalable, distributed SQL engine optimized for both batch and interactive workloads.
What sets Databricks SQL apart is its ability to query data directly from your data lake without complex ETL processes, while still delivering the performance traditionally associated with purpose-built data warehouses.
The platform's integration with Databricks Unity Catalog further enhances its capabilities by providing unified governance for all data assets, ensuring consistent security, access control, and lineage tracking across your entire data estate.
However, as data volumes grow, even Databricks SQL requires thoughtful optimization to maintain performance. The platform offers several built-in mechanisms—from query execution plans to data layout strategies—that can dramatically improve efficiency when properly leveraged.
Seven advanced query optimization techniques for Databricks SQL
Let's explore seven proven optimization techniques that will improve your Databricks SQL performance, slash processing times, reduce cloud costs, and deliver insights faster, without having to increase your infrastructure budget.
1. Analyze query execution plans to identify bottlenecks
Execution plans are the blueprints that reveal how Databricks SQL processes your queries. They show the sequence of operations, data movement patterns, and resource utilization across your cluster. Understanding these plans is essential for identifying performance bottlenecks before they impact your business.
To access an execution plan, you can use the EXPLAIN ANALYZED command. The resulting output details every operation, from scanning source tables to performing joins and aggregations. Pay special attention to stages with large data shuffle volumes or unexpected broadcast operations—these often indicate optimization opportunities.
Look for telltale inefficiency patterns like BroadcastNestedLoopJoin operations on large tables, which signal that the optimizer is falling back to expensive join strategies. Similarly, full table scans (FileScan without filters) indicate missing partition or filter pushdown opportunities that could dramatically reduce processing time.
The most valuable insights often come from comparing execution plans before and after optimization attempts. For example, adding a specific join hint might transform an expensive SortMergeJoin into an efficient BroadcastHashJoin, reducing execution time from minutes to seconds for queries joining a large fact table with smaller dimension tables.
Execution plans also reveal skew problems when certain tasks take significantly longer than others. When monitoring task metrics, look for outliers in processing time or shuffle read/write volumes that indicate uneven data distribution—a common cause of cluster imbalance that slows down your entire query.
2. Implement strategic data partitioning for faster queries
Partitioning divides your Delta tables into smaller, manageable chunks based on specific columns, allowing Databricks to scan only relevant data partitions. Proper partitioning can transform queries from processing terabytes to mere gigabytes, dramatically reducing both execution time and compute costs.
Choose partition columns based on your most common query patterns. Date columns are ideal candidates for tables queried with time-based filters. For example, a retail processing company's dataset might be partitioned by order_date, allowing queries filtering for specific months to read only relevant partitions instead of scanning the entire dataset.
Optimal partition sizing balances performance against partition management overhead. Aim for partitions between 1GB and 10GB—too small creates excessive metadata operations, while too large reduces the benefits of partition pruning. For time-based partitioning, this typically means daily partitions for large datasets and monthly partitions for smaller ones.
However, avoid over-partitioning with multiple columns, which exponentially increases the partition count. A table partitioned by both date and region might seem logical, but can quickly generate thousands of small partitions. Instead, use Z-ordering as a complementary technique for multi-dimensional filtering.
The results can be impressive. Well-partitioned tables often cut query times by 50% or more, especially for large analytical workloads. This speed boost occurs because Databricks SQL can use partition pruning, immediately eliminating irrelevant partitions before reading any data.
3. Boost performance with Delta cache and file compaction
Databricks Delta cache provides an in-memory layer that accelerates repeated queries by caching frequently accessed data. This two-tier caching system stores data in both memory and local SSD storage on worker nodes, eliminating time-consuming cloud storage fetches for subsequent operations.
Configure your clusters to maximize cache benefits by setting appropriate spark.databricks.io.cache.maxDiskUsage and spark.databricks.io.cache.maxMetaDataCache parameters. For analytical workloads that repeatedly access the same tables, allocating 50% of available disk space to cache can reduce query times by up to 10x compared to uncached execution.
Small files plague many Delta Lake deployments, creating excessive metadata operations and suboptimal read patterns. Regular file compaction with the OPTIMIZE command consolidates these small files into larger, more efficient ones. Run the OPTIMIZE command on recently modified partitions to maintain optimal performance.
Pair OPTIMIZE with VACUUM operations to manage storage costs, but be cautious with retention periods. The default 7-day retention prevents active queries from failing, but you may need longer periods in environments with long-running analyses. Always run VACUUM DRY RUN first to prevent accidental data loss.
Implementing an automated maintenance job that runs OPTIMIZE nightly on recent partitions and VACUUM weekly on the entire table provides the best balance of performance and storage efficiency.
4. Optimize join operations to reduce processing time
Joins are often the most expensive operations in complex analytical queries. Databricks SQL offers three primary join strategies:
- Broadcast joins for small-to-large table combinations
- Shuffle joins when both tables are large, and
- Sort-merge joins for pre-sorted data.
Selecting the right strategy for your data characteristics can reduce processing time by orders of magnitude. Additionally, choosing the right data tool plays an equally important role in optimizing performance.
Use broadcast joins whenever one table can comfortably fit in memory (typically under 10GB). By explicitly adding broadcast hints to your query, you force the small table to be distributed to all nodes, eliminating expensive data shuffling. This approach works particularly well for dimension tables joined to large fact tables.
For joins between large tables, ensure join columns have consistent data types and encodings. Mismatched types force implicit conversions that prevent optimizations. Casting or converting data types may seem harmless, but it can make the difference between a three-minute and a thirty-minute query execution.
Reorder joins to filter data early in the execution flow. Always place the most selective filters and joins first in your query to reduce the data volume for subsequent operations. A query that first joins a 1TB fact table with a 500GB table before applying a filter that eliminates 99% of records will run drastically slower than one applying the filter first.
Use approximation techniques for exploratory analyses where absolute precision isn't required. Functions that approximate distinct counts instead of calculating exact counts can provide near-instant results with minimal accuracy trade-offs. This approach is particularly valuable during data exploration phases when analysts need quick feedback rather than exact counts.
5. Accelerate queries with efficient filtering and predicate pushdown
Predicate pushdown moves filter conditions from the query processing layer down to the storage layer, enabling Databricks to skip entire data blocks without loading them into memory. This optimization often provides the single biggest performance gain for selective queries, turning full table scans into targeted reads.
Write WHERE clauses with expressions that can be pushed down to Delta Lake storage. Simple comparisons against partition columns or indexed fields work best. Complex expressions using UDFs or non-deterministic functions cannot be pushed down and force full data scans.
Combine partitioning with Z-ordering to enable multi-dimensional filtering. While partitioning works on a single dimension, Z-ordering co-locates related data within files based on multiple columns. For example, Z-ordering by customer and product IDs enables efficient filtering on either dimension or both simultaneously.
Common mistakes that prevent pushdown include wrapping columns in functions (even simple ones), using complex expressions in filters, or referencing columns from different tables. Rewriting date functions to use direct date comparisons can transform a slow query into one that leverages both partitioning and pushdown.
Regularly compute statistics on your tables to ensure the query optimizer has accurate information about your data distribution. Up-to-date statistics help the optimizer make better decisions about join strategies and predicate pushdown opportunities, especially as your data volumes and patterns change over time.
6. Balance workloads by addressing data skew
Data skew occurs when certain values appear much more frequently than others, causing uneven distribution of work across your cluster. In Databricks SQL, this often manifests as a few executor tasks taking significantly longer than others, creating a bottleneck that delays your entire query despite most cluster resources sitting idle.
Addressing data skew is crucial for performance, just as overcoming data silos is essential for effective data management.
Identify skew problems through execution metrics by looking for tasks within the same stage that process significantly different data volumes. When the "Maximum" task input or shuffle read is 10x or more than the "Average," you're likely facing skew issues. These metrics are visible in the Spark UI under the "Stages" tab for completed queries.
Salting is an effective technique for handling skewed join keys. By adding random values to skewed keys, you can distribute the processing more evenly. This approach creates a derived key that includes the original key plus a random component, allowing for more balanced processing across the cluster.
For skewed aggregations, use a two-stage approach: first aggregate locally within partitions, then combine results. This reduces the data volume that needs to be shuffled to the skewed keys. Implementing pre-aggregation at a finer granularity can dramatically improve performance for tables with highly skewed distributions.
Broadcasting smaller tables can bypass skew issues entirely for join operations. Even when a dimension table is relatively large (up to several GB), forcing a broadcast join often outperforms other join strategies when the fact table has a highly skewed join key distribution, as it eliminates the need for data shuffling altogether.
7. Improve complex queries with smart materialization strategies
Breaking complex queries into stages through strategic materialization can dramatically improve performance and maintainability. In Databricks SQL, you have multiple materialization options: Common Table Expressions (CTEs), temporary views, cached tables, and physical Delta tables, each with different performance characteristics.
CTEs (WITH clauses) provide logical separation but may not materialize results between query stages. The optimizer can still rearrange and combine operations across CTEs, which sometimes improves performance but can also lead to repeated computation of expensive operations. Use CTEs primarily for query readability rather than performance optimization.
Temporary views persist within your session and provide similar logical separation to CTEs. However, they don't physically materialize results unless explicitly cached. For multi-step analyses where intermediate results are referenced multiple times, consider caching temporary views to store results in memory.
For frequently used intermediate results, consider materializing to physical Delta tables. This approach is particularly valuable when the intermediate result is substantially smaller than the source data or requires significant computation. Physical materialization also enables optimization techniques like partitioning and Z-ordering.
Balance materialization decisions against storage costs and data freshness requirements. Excessive materialization increases storage costs and creates data management overhead, while insufficient materialization forces repeated computation.
For rapidly changing data, implement incremental materialization patterns that only process new or changed records rather than repeatedly rebuilding entire derived tables.
Streamline your data techniques with self-service tools
While Databricks provides powerful query optimization capabilities, complex data pipelines still require significant expertise to build and maintain.
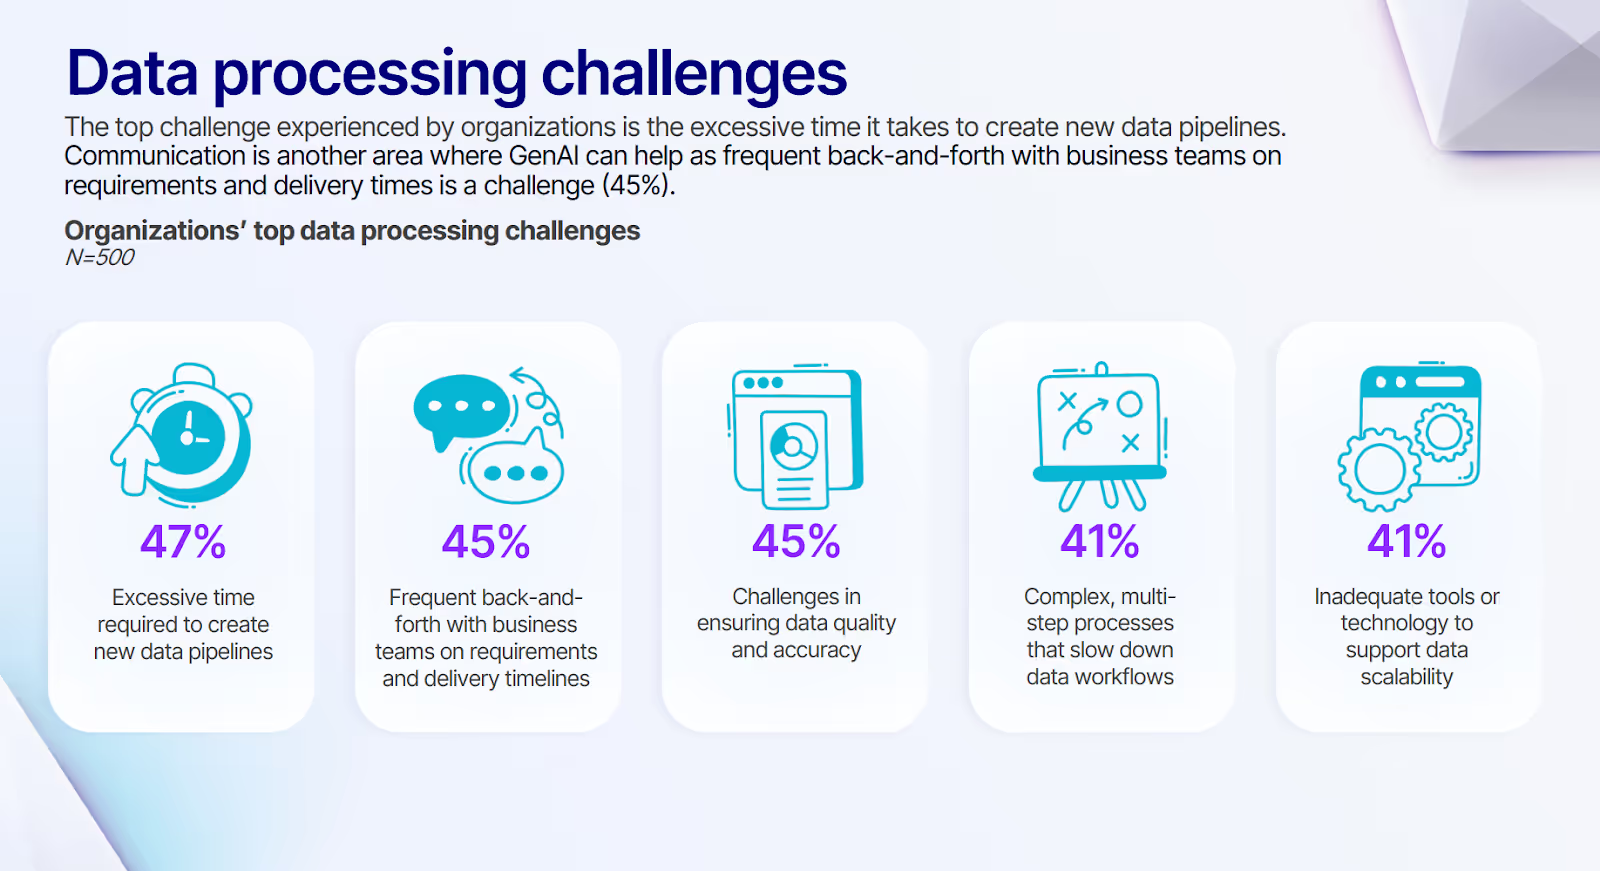
According to our survey across organizations, almost half of the respondents (45%) report that frequent back-and-forth with business teams on requirements and delivery timelines creates significant bottlenecks, slowing down data-driven decision making and straining engineering resources.
Modern self-service platforms bridge this gap by enabling both technical and business users to collaborate on pipeline development. Visual interfaces and AI-assisted development dramatically reduce the expertise required to build optimized data flows, while maintaining the governance guardrails that central data teams need.
Here’s how Prophecy works natively with Databricks to simplify data pipeline development without sacrificing performance or control:
- Visual SQL pipeline design that generates optimized code automatically
- Built-in best practices for partitioning, filtering, and join operations
- AI-powered data transformation that implements optimal query patterns
- Self-service pipeline creation for business users with IT governance guardrails
- Version control integration for collaborative pipeline development
- Automated dependency management for complex multi-stage pipelines
- Comprehensive observability to quickly identify and resolve performance issues
To bridge the gap between powerful cloud platforms and practical business outcomes, explore AI-Powered Data Transformation to discover how intelligent AI-assisted tools enable faster data delivery while maintaining proper governance.

Ready to give Prophecy a try?
You can create a free account and get full access to all features for 21 days. No credit card needed. Want more of a guided experience? Request a demo and we’ll walk you through how Prophecy can empower your entire data team with low-code ETL today.
Ready to see Prophecy in action?
Request a demo and we’ll walk you through how Prophecy’s AI-powered visual data pipelines and high-quality open source code empowers everyone to speed data transformation
Get started with the Low-code Data Transformation Platform
Meet with us at Gartner Data & Analytics Summit in Orlando March 11-13th. Schedule a live 1:1 demo at booth #600 with our team of low-code experts. Request a demo here.
Related content
A generative AI platform for private enterprise data
Introducing Prophecy Generative AI Platform and Data Copilot
Ready to start a free trial?
Lastest posts
The AI Data Prep & Analysis Opportunity

The Future of Data Is Agentic: Key Insights from Our CDO Magazine Webinar