How Four Analytics Types Create A Complete Business Intelligence Framework
Discover how descriptive, diagnostic, predictive, and prescriptive analytics create a complete intelligence framework. Learn implementation strategies that turn overwhelming data into a strategic advantage.
Data has become the lifeblood of modern business, but collecting it is just the first step. The real challenge lies in transforming raw data into actionable insights that drive strategic decisions. This is where analytics comes in—not as a single approach, but as a spectrum of increasingly sophisticated methods.
Organizations that master this analytics spectrum gain a powerful competitive advantage. From understanding historical performance to predicting future outcomes and automatically recommending optimal actions, each type of analytics builds on the previous to unlock greater business value.
In this guide, we'll explore the four types of business analytics, how they differ, and how they work together to transform data into strategic impact.
Descriptive vs diagnostic vs predictive vs prescriptive analytics
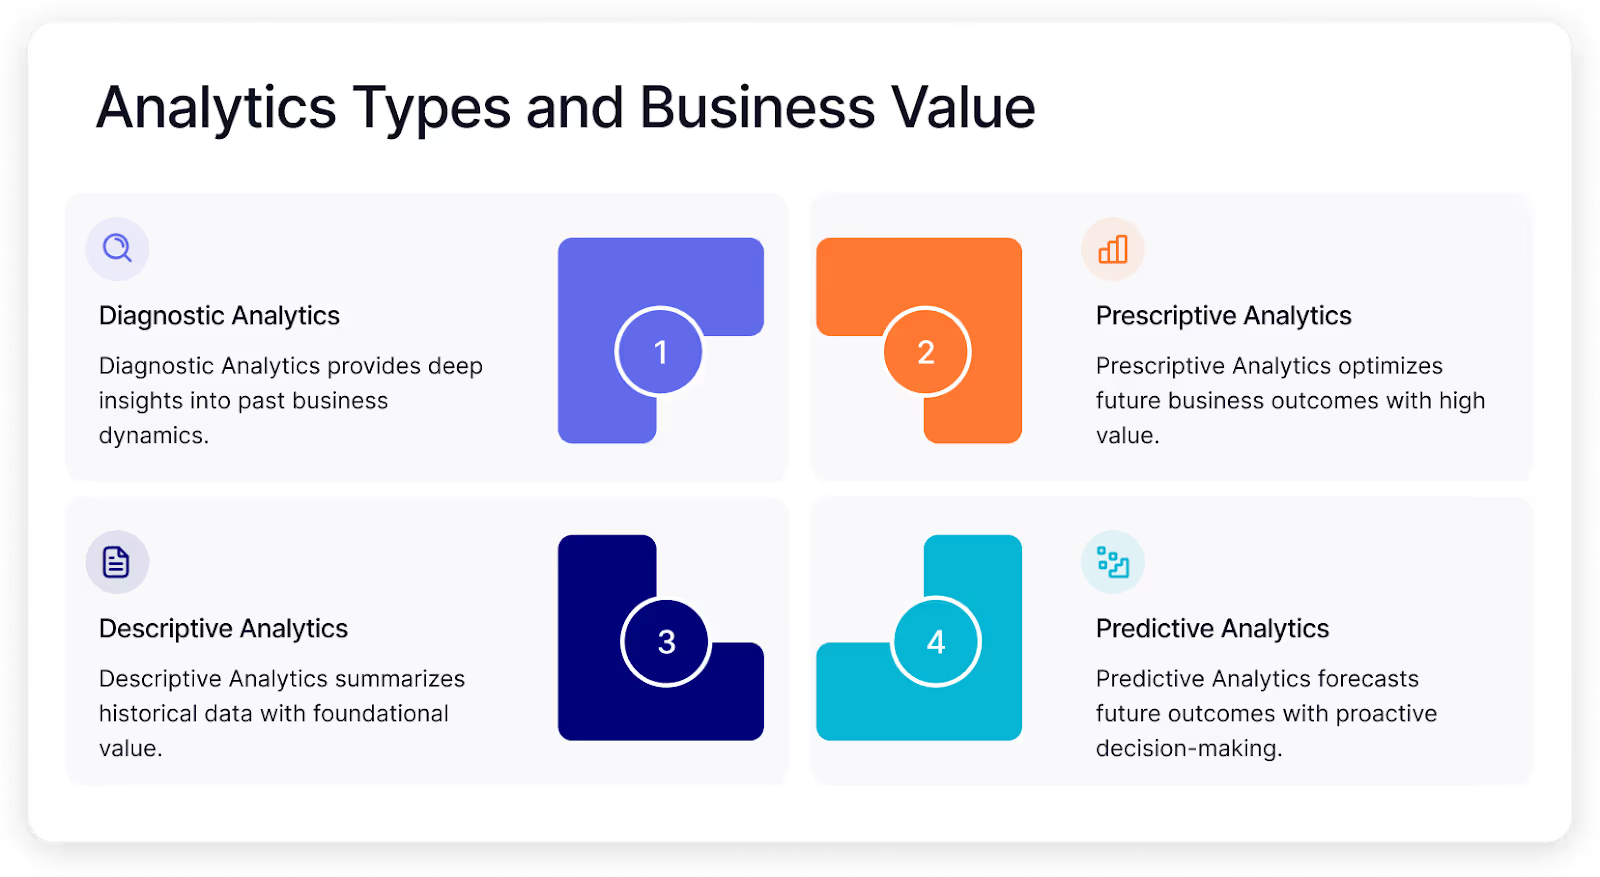
Business analytics exists on a continuum from backward-looking to forward-looking approaches. While descriptive analytics tells you what happened, diagnostic analytics explains why it happened. Predictive analytics forecasts what might happen next, and prescriptive analytics recommends what you should do about it.
Each type requires progressively more advanced data capabilities and delivers increasing business value. Though many organizations focus heavily on one type, the greatest impact comes from implementing them as an integrated ecosystem that transforms historical data into strategic action.
But first, let’s see a quick overview of these different types of business analytics:
Now that we've mapped out the key differences between these four analytics approaches, let's dive deeper into each.
What is descriptive analytics?
Descriptive analytics is the process of examining historical data to understand what has happened in the past and create a clear picture of current performance. It forms the foundation of the analytics pyramid, transforming raw data into understandable summaries that answer the fundamental question: "What happened?"
This retrospective approach provides insights into historical performance and establishes the baseline metrics and KPIs that drive day-to-day business operations.
Despite being the most basic form of analytics, descriptive analytics remains the most widely implemented. Organizations rely on descriptive analytics to track KPIs, monitor performance trends, and communicate business results across departments. Dashboards displaying metrics like revenue, conversions, customer acquisition costs, and inventory levels exemplify descriptive analytics in action.
Descriptive analytics has evolved significantly from basic reporting to interactive dashboards that allow users to slice and dice historical data from multiple angles. While potentially simple in concept, getting descriptive analytics right is crucial—decisions based on inaccurate descriptive insights cascade into errors throughout more advanced analytics initiatives.
Techniques used in descriptive analytics
The toolbox for descriptive analytics includes several core methodologies that transform raw data into meaningful insights:
- Data aggregation and summarization techniques convert individual data points into useful metrics like sums, averages, percentages, and growth rates. These are then brought to life through data visualization—charts, graphs, and dashboards that make patterns immediately apparent to business users.
- Statistical measures provide additional context, with metrics like standard deviation revealing data distribution and correlation coefficients identifying relationships between variables. Segmentation and filtering capabilities enable users to analyze subsets of data based on specific criteria, uncovering insights that might be obscured in aggregate views.
Modern self-service BI tools have democratized these capabilities, enabling business users without technical backgrounds to create their own visualizations and explore data independently. These visual tools provide intuitive interfaces for building interactive dashboards without coding knowledge.
The effectiveness of descriptive analytics ultimately depends on data preparation and data ingestion processes—the often-overlooked process of collecting, cleaning, and organizing data from disparate sources. Organizations frequently struggle with this foundational step due to siloed systems, inconsistent formatting, and data quality issues that require significant engineering effort to resolve.
Applications and use cases of descriptive analytics
Descriptive analytics powers essential business monitoring across virtually every department and industry. For example, in sales and marketing, sales teams use descriptive analytics to track revenue by product, region, and customer segment, identifying top performers and opportunities for improvement.
Marketing departments analyze campaign metrics like click-through rates, conversion rates, and customer acquisition costs to optimize channel performance and budget allocation.
Financial dashboards also consolidate revenue, expenses, and profitability metrics, highlighting variances from forecasts and historical trends. Operations teams monitor efficiency metrics like throughput, cycle time, and resource utilization to identify bottlenecks and improvement opportunities.
Customer support teams also track metrics like response time, resolution rate, and satisfaction scores to maintain service quality. Product teams analyze user behavior metrics to understand feature adoption, usage patterns, and potential friction points in the customer journey.
Similarly, HR departments use descriptive analytics to monitor workforce metrics, including turnover rates, time-to-hire, and employee satisfaction scores. These insights help identify potential issues before they affect productivity and guide strategic workforce planning.
What is diagnostic analytics?
Diagnostic analytics is an investigative approach that examines why certain events or trends occurred by identifying the causal factors behind them. It takes a crucial step beyond simply showing what happened to uncovering why it happened.
This detective work of data analysis delves into relationships between variables, anomalies, and patterns to determine the root causes that explain the outcomes observed in descriptive analytics.
Think of diagnostic analytics as the detective work of data analysis. When metrics unexpectedly rise or fall, diagnostic analytics helps determine the contributing factors through a process of systematic investigation. It connects the dots between seemingly unrelated variables to reveal hidden relationships and root causes.
The value of diagnostic analytics lies in its ability to transform observations into understanding. Instead of merely knowing that sales declined last quarter, diagnostic analysis might reveal that the decline occurred primarily in specific regions and coincided with a competitor's promotional campaign. This deeper understanding forms the foundation for effective response strategies.
Diagnostic capabilities have traditionally required specialized skills, but the rise of self-service analytics tools has democratized these techniques. Modern platforms enable business users to conduct their own diagnostic investigations through intuitive interfaces, reducing dependency on data scientists while accelerating the path from question to insight.
Techniques used in diagnostic analytics
Diagnostic analytics employs a range of powerful techniques to peel back the layers of business performance and expose underlying factors:
- Drill-down exploration allows analysts to navigate from high-level metrics to granular details, examining data across multiple dimensions such as time, geography, product categories, and customer segments. This hierarchical exploration often reveals that problems affecting overall metrics are concentrated in specific areas.
- Correlation analysis identifies relationships between variables, highlighting potential causal connections. By measuring how strongly metrics move together, analysts can prioritize which factors to investigate further. Modern tools visualize these relationships through correlation matrices and scatter plots that make patterns immediately apparent.
- Root cause analysis systematically eliminates potential explanations until the most likely causes are identified. Techniques like the "5 Whys" methodology and fishbone diagrams structure this investigation process, ensuring that analysts identify fundamental causes rather than symptoms.
- Anomaly detection algorithms identify unusual patterns that deviate from expected behavior, focusing attention on significant outliers that warrant further investigation. These techniques help analysts separate meaningful signals from normal business fluctuations.
Applications and use cases of diagnostic analytics
Diagnostic analytics transforms business operations by uncovering the "why" behind performance metrics. For example, in retail, when a product category shows declining sales, diagnostic analysis might reveal that the drop occurred primarily in specific store locations where a competitor opened nearby. This insight leads to targeted competitive responses rather than broad-based price cuts that would unnecessarily reduce margins across all stores.
Healthcare providers also use diagnostic analytics to investigate factors contributing to readmission rates. By analyzing patient demographics, treatment protocols, post-discharge care, and facility data, they can identify specific patient populations at higher risk and implement targeted interventions to improve outcomes.
In manufacturing, operations teams leverage diagnostic analytics to troubleshoot quality issues. When defect rates spike, analysts can correlate the timing with changes in suppliers, materials, equipment settings, or personnel to quickly identify and address the root cause before it affects more products.
Financial services firms also apply diagnostic techniques to understand fluctuations in customer acquisition costs. What initially appears as a general increase in marketing expenses might be diagnosed as stemming from decreased conversion rates in specific digital channels, prompting focused optimization efforts rather than across-the-board budget cuts.
What is predictive analytics?
Predictive analytics is the branch of advanced analytics that uses historical data, statistical algorithms, and machine learning techniques to identify the likelihood of future outcomes. It represents a fundamental shift from looking backward to looking forward, forecasting what is likely to happen in the future based on historical patterns and trends.
This forward-looking perspective enables organizations to anticipate changes, identify emerging opportunities, and mitigate potential risks before they materialize. Predictive models analyze historical data patterns to generate probabilities of specific outcomes, allowing businesses to prepare for likely scenarios rather than simply react to events after they occur.
The evolution of predictive analytics has accelerated dramatically in recent years. Traditional statistical methods like regression analysis have been supplemented by sophisticated machine learning algorithms capable of detecting complex, non-linear patterns in data.
Additionally, the integration of AI in ETL processes enhances data integration, enabling predictive models to access cleaner and more relevant data. Cloud computing has made these computationally intensive techniques accessible to organizations without specialized infrastructure.
However, despite its power, predictive analytics doesn't operate in isolation. Its accuracy depends heavily on the quality of descriptive data and the insights gained through diagnostic analysis. Understanding historical patterns and their causes creates the foundation for reliable predictions.
Techniques used in predictive analytics
The predictive analytics toolkit spans from traditional statistical methods to cutting-edge machine learning approaches:
- Regression analysis forms the foundation of many predictive models, establishing relationships between dependent and independent variables to forecast numerical outcomes. Linear regression predicts continuous values like sales volumes or customer lifetime value, while logistic regression estimates the probability of binary outcomes such as customer churn or conversion.
- Classification algorithms assign items to categories based on their characteristics. Decision trees create a flowchart-like structure of if-then rules that are easily interpretable. Random forests combine multiple decision trees to improve accuracy at the cost of some transparency. Support vector machines excel at creating clear boundaries between categories in complex datasets.
- Time series forecasting specializes in predicting future values based on time-ordered data. ARIMA (Autoregressive Integrated Moving Average) models capture temporal dependencies in sequential data, making them valuable for sales forecasting, inventory planning, and demand prediction.
- Deep learning approaches using neural networks can capture extremely complex patterns beyond the capabilities of traditional algorithms. These techniques excel with unstructured data like images, text, and audio, enabling predictions based on information that previously couldn't be effectively analyzed.
Applications and use cases of predictive analytics
Predictive analytics drives strategic advantage across industries and business functions. For example, in retail and e-commerce, demand forecasting models analyze historical sales patterns along with external factors like seasonality, promotions, and economic indicators to predict future product demand.
These predictions enable optimal inventory management, reducing both stockouts and excess inventory costs while improving customer satisfaction.
Financial institutions also use predictive analytics for credit scoring and risk assessment. By analyzing past repayment behavior alongside hundreds of other variables, lenders can more accurately predict default probability for loan applicants. This enables more precise risk-based pricing and reduces default rates.
Similarly, manufacturing operations employ predictive maintenance models that analyze equipment sensor data to forecast when machines are likely to fail. By scheduling maintenance before breakdowns occur, companies minimize unplanned downtime, extend equipment life, and optimize maintenance resource allocation.
Telecommunications providers also predict customer churn by identifying behavior patterns that historically precede cancellations. These models monitor indicators like declining usage, increased support tickets, or competitive price sensitivity, enabling proactive retention offers to high-risk customers before they decide to leave.
What is prescriptive analytics?
Prescriptive analytics is the most advanced form of business analytics that recommends actions to take based on predicted outcomes and business objectives. It represents the pinnacle of the analytics spectrum, moving beyond predicting what might happen to recommending what actions should be taken.
This sophisticated approach combines predictive models with business rules, constraints, and optimization techniques to identify the optimal path forward.
The true power of prescriptive analytics lies in its ability to evaluate multiple possible scenarios and their likely outcomes, comparing potential strategies against business objectives to determine the best course of action. Rather than providing a single forecast, prescriptive systems present decision-makers with optimized recommendations that balance competing priorities.
Prescriptive analytics closes the loop between insight and action, creating a direct pathway from data to business impact. For example, instead of merely predicting that customer churn will increase, a prescriptive system might recommend specific retention offers to particular customer segments, optimized to maximize retention while minimizing discount costs.
While technically complex, prescriptive capabilities have become more accessible through specialized platforms and industry-specific solutions. Some implementations operate as automated decision systems that continuously optimize operations without human intervention, while others serve as decision support tools that augment human judgment with data-driven recommendations.
Techniques used in prescriptive analytics
Prescriptive analytics employs sophisticated methods that build upon predictive insights to generate optimal recommendations:
- Optimization algorithms identify the best possible solution given specific constraints and objectives. Linear programming determines optimal resource allocation when relationships between variables follow straight-line patterns. More complex problems require nonlinear programming or techniques like genetic algorithms that can navigate vast solution spaces efficiently.
- Simulation modeling creates virtual environments that mimic real-world systems, allowing analysts to test "what-if" scenarios without real-world consequences. Monte Carlo simulation runs thousands of randomized scenarios to quantify uncertainty and risk, producing probability distributions of possible outcomes rather than single-point estimates.
- Decision analysis techniques formalize the decision-making process, incorporating uncertainty and comparing options based on expected value. Decision trees map out possible choices, their consequences, and subsequent decisions to identify optimal paths. Influence diagrams visualize the relationships between decisions, uncertainties, and outcomes.
- Reinforcement learning, a specialized form of machine learning, trains algorithms to make sequences of decisions by rewarding desired outcomes. These systems improve through trial and error, making them particularly valuable for dynamic environments where conditions constantly change and simple rules-based approaches would fail.
Applications and use cases of prescriptive analytics
Across industries, prescriptive analytics transforms how organizations approach their most complex decisions.
Dynamic pricing systems in airlines and hotels continuously optimize pricing strategies based on demand forecasts, competitor pricing, available inventory, and customer willingness to pay. These systems automatically adjust thousands of prices daily to maximize revenue while maintaining target occupancy rates.
Supply chain networks also use prescriptive analytics to optimize distribution strategies when disruptions occur. When weather events, political unrest, or supplier issues threaten delivery timelines, these systems recommend the most cost-effective rerouting options that minimize customer impact while considering transportation costs, inventory levels, and service agreements.
Healthcare providers also employ prescriptive analytics to optimize patient scheduling and resource allocation. These systems balance factors like procedure urgency, provider availability, equipment utilization, and patient preferences to maximize facility throughput while minimizing patient wait times and ensuring critical cases receive priority.
Marketing campaign optimization tools determine the ideal channel mix, message timing, and audience targeting to maximize campaign ROI. These systems continuously reallocate budget across channels based on real-time performance data, shifting resources to high-performing segments while testing alternatives for underperforming areas.
How to avoid self-service analytics implementation failure
The analytics landscape is undergoing a fundamental transformation as organizations race to put powerful analytical capabilities directly into the hands of business users. This shift isn't optional—it's becoming essential as the gap between data supply and insight demand widens.
Companies that fail to democratize analytics face growing request backlogs, with business teams waiting weeks or months for data needed to make time-sensitive decisions.
Yet democratization without appropriate governance leads directly to the "enabled with anarchy" trap, where business users gain access to self-service analytics tools without proper guardrails, and organizations quickly lose track of which analyses represent the source of truth.
Different teams analyzing the same question reach contradictory conclusions, leading to fractured decision-making and strategic confusion.
Deploying effective self-service requires a balanced approach that starts with aligning analytics capabilities to business maturity. Consider your organization's data foundation—companies struggling with fragmented sources and inconsistent definitions should prioritize strengthening these basics before pursuing sophisticated analytical approaches. Resource availability matters too, as both technical infrastructure and human expertise must support your strategy.
Successful self-service programs embed governance directly into the analytics process rather than treating it as a separate gatekeeping function. You should implement platforms that enforce data quality, maintain consistent definitions, and provide appropriate access controls without creating unnecessary friction.
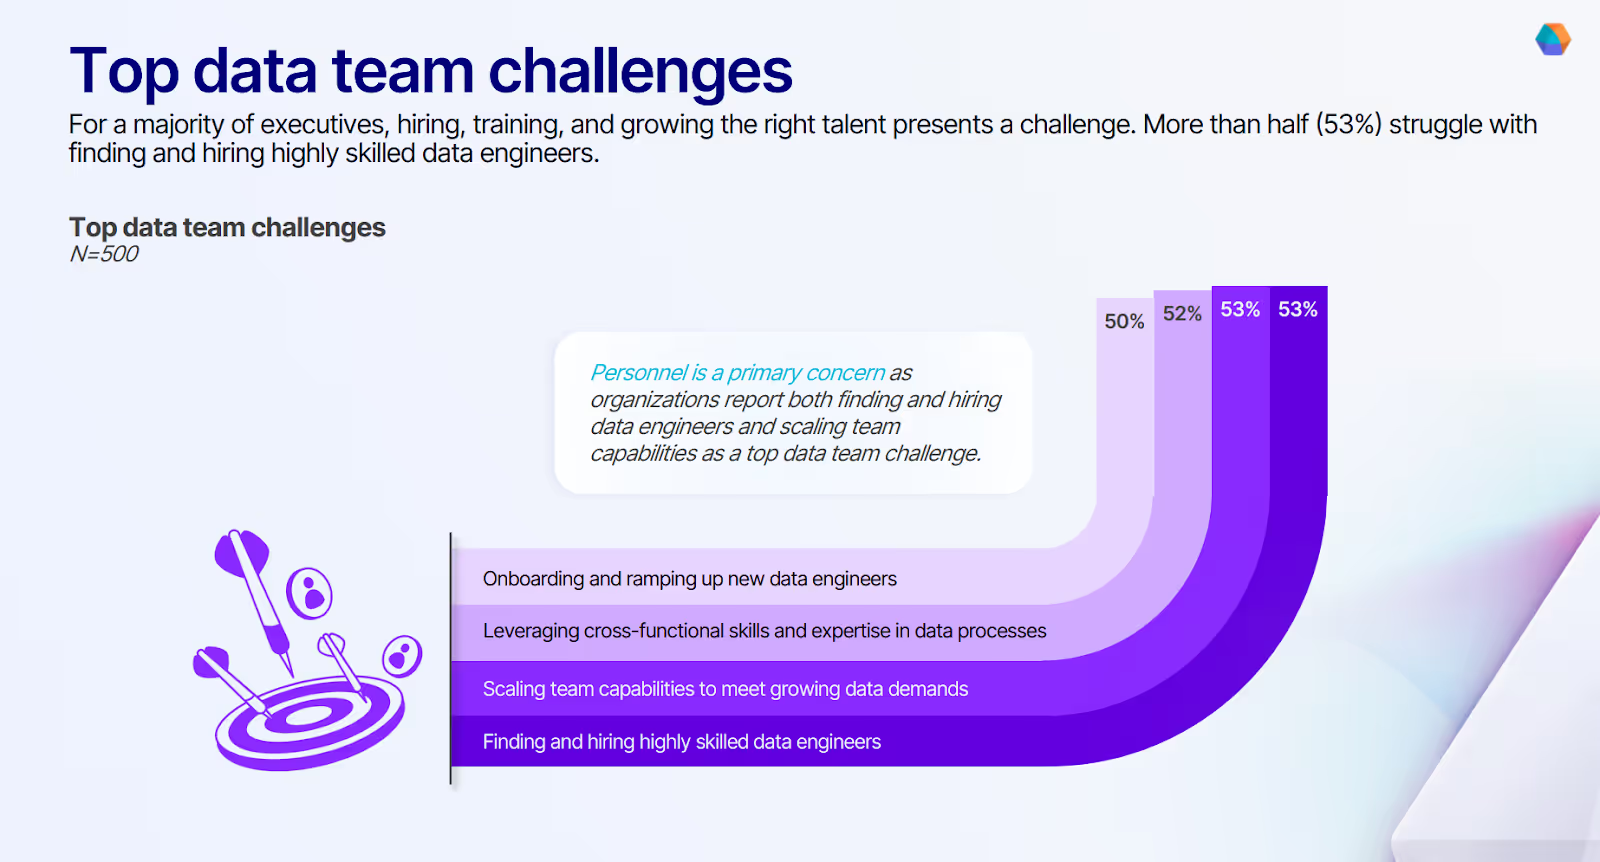
This democratization with proper governance addresses a persistent bottleneck: the scarcity of data engineering and data science talent that has traditionally slowed analytics initiatives and created backlogs of business requests.
When security and governance become invisible enablers rather than visible obstacles, adoption accelerates while risks diminish.
The most effective organizations match analytics technology to specific decision-making needs rather than viewing the four types as a mandatory progression. Some business questions require only descriptive capabilities, while others demand advanced predictive or prescriptive approaches.
By delivering the right level of sophistication for each use case, you maximize ROI while avoiding unnecessary complexity.
Build a self-service analytics ecosystem with Prophecy
Creating a self-service analytics ecosystem that spans from descriptive to prescriptive to all types of analytics remains challenging for most organizations. The technical complexity of data preparation and pipeline development creates bottlenecks that prevent business users from accessing the data they need for analytics.
Traditional approaches force organizations to choose between governance and self-service—either maintaining strict controls that slow down business users or enabling faster access that compromises data quality and security. This false dichotomy has prevented many organizations from realizing the full potential of their data assets.
Here’s how Prophecy resolves this dilemma by enabling governed self-service data analytics:
- Visual, AI-assisted pipeline development allows business users to build data workflows without coding
- Native integration with Databricks provides enterprise-scale performance within your existing data platform
- Built-in governance controls ensure consistent standards, security, and compliance
- Version control and collaboration features bridge the gap between business users and data engineers
- Pre-built connectors simplify data access from diverse sources, including files, databases, and applications
- End-to-end workflow capabilities support the entire analytics spectrum from data ingestion to reporting
- Data profiling and quality checks build confidence in analytics outputs
To break free from the technical bottlenecks preventing business users from accessing critical data, explore Designing a Copilot for Data Transformation to build an integrated analytics ecosystem that balances governance with accessibility.

Ready to give Prophecy a try?
You can create a free account and get full access to all features for 21 days. No credit card needed. Want more of a guided experience? Request a demo and we’ll walk you through how Prophecy can empower your entire data team with low-code ETL today.
Ready to see Prophecy in action?
Request a demo and we’ll walk you through how Prophecy’s AI-powered visual data pipelines and high-quality open source code empowers everyone to speed data transformation
Get started with the Low-code Data Transformation Platform
Meet with us at Gartner Data & Analytics Summit in Orlando March 11-13th. Schedule a live 1:1 demo at booth #600 with our team of low-code experts. Request a demo here.
Related content
A generative AI platform for private enterprise data
Introducing Prophecy Generative AI Platform and Data Copilot
Ready to start a free trial?
Lastest posts
The AI Data Prep & Analysis Opportunity
The Future of Data Is Agentic: Key Insights from Our CDO Magazine Webinar